
Category Share vs Keyword Share: Comparison
Category share shows market position; keyword share shows search-term visibility—both are needed to diagnose ASO and app growth.
If I had to boil it down to one line, it’s this: category share shows my position in a category, while keyword share shows my visibility on search terms that merchants type in.
That split matters because the same app can look strong in one metric and weak in the other. An app may rank well in a category page but miss terms like “product review app” or “cart upsell.” Or it may show up for a few high-intent searches and still have weak category presence.
Here’s the short version:
- Category share = my app’s estimated slice of visibility inside a Shopify App Store category
- Keyword share = my app’s estimated slice of visibility across tracked search queries
- Category share is for market position
- Keyword share is for search-term decisions
- Neither metric is exact
- I need both, then I check installs, reviews, and conversion rate
One stat makes the difference clear: the top 10 search results get about 88% of clicks. So a small move near the top of search can matter more than a similar move far down the results. On the category side, if category reviews grow 30% year over year and my app grows only 20%, I’m still growing, but I’m losing ground versus peers.
Quick Comparison
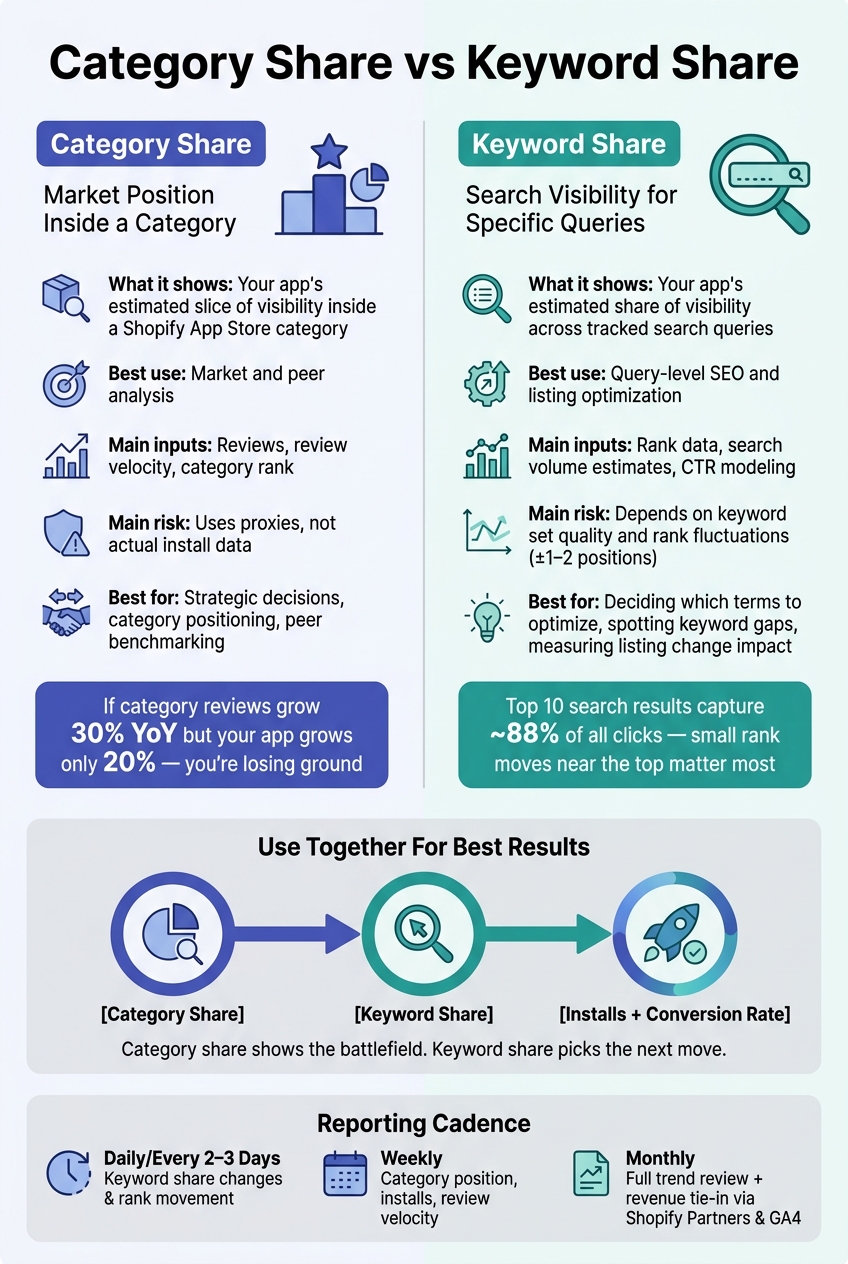
Category Share vs Keyword Share: Side-by-Side Comparison
| Metric | What it shows | Best use | Main inputs | Main risk |
|---|---|---|---|---|
| Category Share | My position inside a category | Market and peer analysis | Reviews, review velocity, category rank | Uses proxies, not installs |
| Keyword Share | My visibility for tracked searches | Keyword research and query-level SEO work | Rank data, search volume, CTR estimates | Depends on keyword set and rank swings |
My simple rule: I use category share to see where I stand, and keyword share to decide what to fix next.
sbb-itb-ce93587
Category Share: Market Position Inside a Shopify App Category
If keyword share tells you how visible your app is in search, category share tells you where you stand inside a Shopify App Store category. It’s a position metric, not a traffic metric.
Here’s the idea: apps that rank near the top of category browse pages can get organic exposure even when no one searches for anything. That’s the main thing category share is trying to show.
Shopify doesn’t publish full install data, so teams usually estimate category share using signals they can actually see:
- Review share for app size
- Review velocity for momentum, such as new reviews over 30 or 90 days
- Relative category rank position for browse-page visibility
Used together, these signals help you judge position inside a category. They do not tell you much about search intent.
That’s why category share works well for compare Shopify App Store optimization tools, but it has limits. It won’t tell you where installs came from. It can’t separate brand-driven installs from category-driven installs, and it won’t show results from outside traffic sources like ads or partner referrals.
So this metric is more useful for strategy than for small listing edits. The big question is simple: are you taking share, or just moving up because the whole category is growing? If total reviews in your category grow 30% year over year but your app’s reviews grow only 20%, your app is still growing in raw terms, but it’s losing ground on a relative basis. That’s a sign to rethink resource allocation, listing optimization, or category positioning.
AppJubilee can automate this tracking with daily review and competitor data, and place category share in the broader context of keyword share instead of treating it like a separate reporting task.
Keyword Share: Search Visibility for Specific Shopify App Store Queries
Category share tells you where an app sits in a category. Keyword share looks at something tighter: how much visibility your app gets for a specific search query. Put simply, it’s your app’s share of attention for that term. Teams usually estimate it using rank data and performance signals. That’s why it’s such a useful way to decide which search terms are worth working on.
How Keyword Share Differs from Keyword Rank
Rank tells you position. Keyword share goes a step further. It gives more weight to positions that are more likely to get seen and clicked, since clicks fall off fast as rankings drop.
In app store search, the top 10 results capture approximately 88% of all clicks. That changes how you read movement in the rankings. Moving from one high spot to another near the top can matter a lot more than making the same jump on page 2.
When to Use Keyword Share
Use keyword share when you need to decide which queries deserve optimization. It works best for query-level choices, while category share is better for the big-picture view of market position.
This metric helps you judge whether a keyword is worth going after. You can weigh search demand, your current share, ranking difficulty, and conversion potential before changing your app title or description. Sometimes a mid-demand term with weak competition can drive more installs than a high-volume keyword where your app only shows up in a low spot.
It’s also helpful for spotting keyword gaps. These are terms where competitors get meaningful visibility and your app barely shows up. For example, if several competing apps rank for "subscription box" or "product add-ons" on a steady basis while your app appears only once in a while, those terms may be good picks for your next metadata update.
Keyword share can also help you measure listing change impact. After a metadata update, track keyword share for the terms you targeted. That gives you a clearer read on whether visibility and installs went up.
The next question is where keyword share works better than category share.
Category Share vs Keyword Share: Scope, Data Limits, and How to Use Each
These two metrics answer different questions.
Category share gives you a broad view of the market. Keyword share zooms in on the exact search terms that move visibility up or down. Put simply: one helps you see the battlefield, the other helps you pick the next move.
| Category Share | Keyword Share | |
|---|---|---|
| Scope | Broad market view | Specific query view |
| Main Question | Where do we stand in our category overall? | Which search terms are helping or hurting us? |
| Common Data Sources | Review counts, category placement, install estimates | Rank positions, search volume estimates, click-through rate modeling |
| Strengths | Strategic context; benchmarks overall competitive posture | Actionable; pinpoints exact terms to optimize or defend |
| Limitations | Relies on proxies; no direct search intent data | Rank does not equal traffic; limited keyword-level conversion visibility |
Where Each Metric Works Better
Use category share when you want to measure category position and overall competitive strength. It shows whether your app is gaining or losing ground in a category like Email Marketing or Product Reviews compared with other apps. That benchmark helps you judge your place in the market: category leader, mid-tier app, or niche player. It also helps you decide whether a category is worth fighting for in the first place.
Use keyword share when you need to make a specific change. It shows which queries are moving, which rivals are taking ground on those terms, and whether a metadata update improved visibility. Category share helps you choose the category battle. Keyword share helps you choose the query fixes.
Data Gaps and Interpretation Risks
Neither metric is a clean, direct measurement.
Category share depends on proxies, mostly review counts and review velocity, because Shopify does not publish install numbers. That means a rising category share estimate may reflect a jump in reviews, not a true increase in installs or revenue. There’s another wrinkle too: category definitions can vary by tool, which changes who gets counted as a competitor.
Keyword share has blind spots as well. It depends on the quality of your tracked keyword list, the accuracy of rank positions, and the assumptions behind click-through rates. Rankings can move by ±1–2 positions based on geography, device type, or personalization. And a keyword can rank well but still do very little for the business if search volume is low or the listing fails to convert.
The best way to read these numbers is simple: treat both as signals, not final proof. Check category share against installs and revenue. Check keyword share against impressions and installs by source.
That comparison sets up a single reporting workflow for both metrics.
How to Use Both Metrics Together for App Performance Analysis
Use category share to understand the market, keyword share to diagnose what changed, and then check both against installs and conversion data.
Start with category share to see whether your overall position against other apps is getting better or slipping. Then move to keyword share to spot the search terms behind that movement. After that, look at installs, review velocity, and conversion rate to separate ASO effects from review spikes or competitor pricing changes.
A Simple Reporting Workflow for Shopify App Teams
The rhythm matters just as much as the metrics.
A practical setup looks like this:
- Daily or every 2–3 days: Watch keyword-share changes and rank movement for analytics and other core terms. Flag major share swings and connect them to recent listing edits with change impact tracking.
- Weekly: Review category-level position and installs. Check review velocity and listing conversion rate. Note any competitor listing edits or pricing changes from the past seven days. Use those notes to decide which keyword clusters need a deeper monthly review.
- Monthly: Review category share trends across the full month, combine keyword share across your core term clusters, and tie visibility data to installs and revenue through your Shopify Partners and GA4 integrations. Identify which competitors are gaining ground the fastest.
AppJubilee supports this workflow with daily keyword tracking, competitor alerts, ranking snapshots, review intelligence, and GA4 and Shopify Partners integrations.
Review all four signals - category share, keyword share, installs, and conversion rate - together in the same reporting cycle.
FAQs
Which metric should I check first?
Check your AJ Score first. It gives you a 0–100 snapshot of your app’s visibility across keyword coverage, ranking quality, core keyword presence, and competitive positioning.
Start there to get a fast read on whether you’re leading your category or missing traffic that should be yours. Then dig into keyword and category share metrics to spot the gaps and decide what to fix first.
Can category share increase while installs stay flat?
Yes. Category share can go up even when installs stay flat because it tracks your visibility against other apps in a browse category, not install volume.
So your app might get better placement and more impressions, but installs may not move if your listing isn’t turning that attention into downloads. When you look at both metrics side by side, you can tell whether the problem is visibility or conversion.
How often should I track keyword share and category share?
Track both on a consistent schedule so you can spot trends instead of chasing random swings. Ranking data changes every day, so check it at least once a week to log what’s happening and make smart updates to your strategy.
It also helps to run a full keyword research pass and refresh your listing copy every 3 to 6 months. Then, after you make listing changes, review performance again at 3, 7, and 14 days.