
Category Visibility Share Study: Shopify Apps
Visibility share, review velocity, and category concentration determine Shopify app exposure, rank swings, and growth potential.

Most Shopify apps get very little attention. In many categories, the top 10 apps take 60%–80% of total visibility, which means most other apps are stuck fighting for a small share of search and browse exposure.
If I had to boil this study down, it comes to this:
- Visibility share is about attention before the click, not just keyword rank or install count.
- Category structure matters a lot. A category with many apps is not always harder if visibility is spread out.
- Reviews and review pace often matter more than star ratings alone.
- Listing edits can help, but the effect usually shows up with a delay.
- Competitor moves can change your share even when you change nothing.
The article also shows how to read category data in plain terms. For example, a 6.8% visibility share in a category with 1,200 apps can mean you have a solid foothold, but whether that is strong or weak depends on concentration, review pace, and how stable rankings are over time.
Here are the main points you should keep in mind:
- In some categories, top apps hold most of the exposure.
- Product Reviews is tightly packed, with Judge.me far ahead on review count.
- Big categories like Analytics may look crowded, but they can be less controlled by one app.
- Listing changes often affect rankings in days or weeks, not right away.
- Weekly review gains like 341 reviews in 7 days can line up with lasting rank gains.
- Volatile keywords can swing by 4–5 positions in a week, so one-day rank checks can mislead you.
A short way to read this study: look at concentration first, then review pace, then rank stability. That gives me a much better view of where an app can grow and where the leaders already control most of the market.
| Focus area | What it tells me |
|---|---|
| Visibility share | How much category attention an app gets |
| Concentration | How much top apps control the category |
| Review velocity | Which apps have momentum right now |
| Listing edits | Whether relevance and conversion may improve |
| Rank stability | Whether gains are holding or fading |
If I am comparing Shopify app optimization tools, that is the lens I would use before I spend time or money trying to move up.
Study Scope, Data Sources, and Method
This study looks at category-level visibility in the Shopify App Store through rank, reviews, and concentration data. With the method set, the next section moves into how visibility clusters across categories.
Inputs Used for Category Share Analysis
The analysis uses six inputs:
- App counts by category - sets the competitive baseline
- Total review counts and average ratings - shows where trust is concentrated
- Review velocity - new reviews gained over a 7-day window, signaling momentum
- Rank positions - across tracked keywords and category pages
- Concentration metrics - top-3 and top-5 share, showing how skewed each category is toward its leaders
AppJubilee tracks 16,595 apps and 2,628 keywords, with 33,201 new reviews added in the last 30 days across an ecosystem averaging 4.70 stars. Since ratings tend to bunch near the top, review volume and review velocity do more to separate apps than star averages alone. That’s an important point: a 4.9-star app and a 4.8-star app can look almost the same at a glance, but their review growth may tell a very different story.
These inputs show more than market size. They show how tightly top positions are controlled by category leaders.
Time Windows and Update Frequency
The study uses layered time windows. Daily tracking picks up immediate reactions to listing edits. A 7-day rolling view shows short-term momentum. Then 30-day or multi-month windows help confirm whether a rank gain is structural or just a short spike.
Timing matters most right after listing edits. Changes are tracked within 48-hour windows, then checked again through weekly and monthly aggregates. That setup makes before-and-after rank shifts easier to read and far less noisy.
Where AppJubilee Fits in Ongoing Tracking
The patterns in this study show what happened. Staying current takes an ongoing tracking layer, and that’s where AppJubilee comes in.
It supports that work through daily keyword rankings, competitor alerts, listing-change tracking, and review intelligence, and ranking snapshots for before-and-after comparisons after edits. Its GA4 and Shopify Partners integrations tie visibility data to installs and revenue in USD, which helps link ranking movement to downstream performance.
Those snapshots are the basis for the category patterns in the next section.
sbb-itb-ce93587
Category Distribution and Concentration Patterns
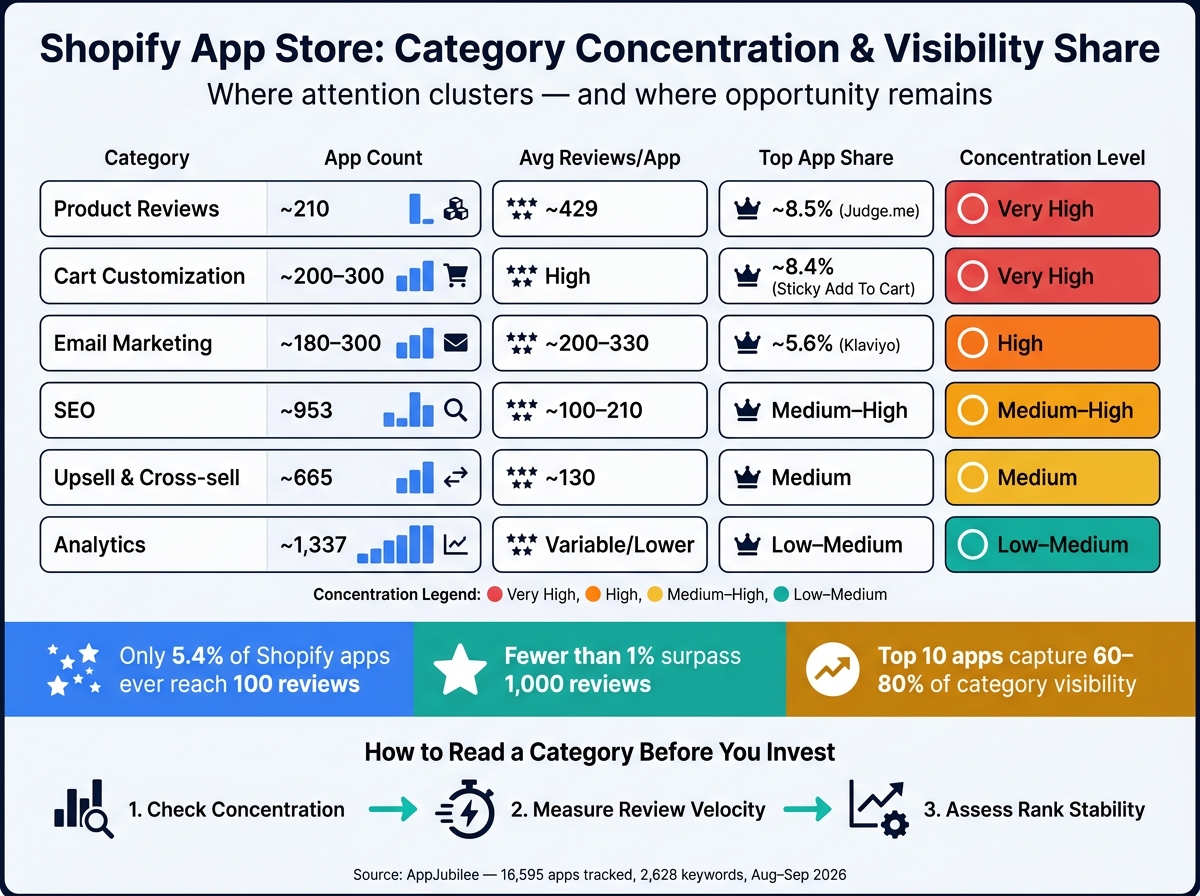
Shopify App Category Visibility: Concentration & Competition Breakdown
Large Categories vs. High-Concentration Categories
A big category isn't the same thing as an open market. Analytics is the largest Shopify category by app count, with 1,337 live apps as of August 2026. After that come SEO (953), Chat (921), Shipping (885), and Discounts (857).
But raw app count only tells part of the story. What matters more is who gets seen. In many categories, visibility isn't spread across hundreds of apps. It tends to pile up around a small group at the top.
Review Concentration and Top-App Share
One of the clearest ways to see this is review concentration. The product review category is a good example: it has 90,169 reviews across just 210 apps, which works out to an average of 429 reviews per app. That's about 2x the per-app review count in most major categories.
And even inside that category, one app stands far above the rest. Judge.me Product Reviews App has 44,548 reviews and added 341 in one week as of September 16, 2026.
So the key issue isn't just category size. It's how much of the attention top apps pull in. The table below lines up category size, review density, and concentration side by side.
| Category | Approx. App Count (Aug 2026) | Avg. Reviews per App | Top-app install share | Concentration level |
|---|---|---|---|---|
| Product Reviews | ~210 | ~429 | ~8.5% (Judge.me) | Very high |
| Cart Customization | ~200–300 | High | ~8.4% (Sticky Add To Cart Bar Pro) | Very high |
| Email Marketing | ~180–300 | ~200–330 | ~5.6% (Klaviyo) | High |
| SEO | ~953 | ~100–210 | Medium–High | Medium–High |
| Upsell & Cross-sell | ~665 | ~130 | Medium | Medium |
| Analytics | ~1,337 | Variable, often lower | Low–Medium | Low–Medium |
Top-app install share figures are based on install data. Review averages are based on category-level analyses.
What Category Structure Tells You About Competitiveness
In highly concentrated categories, the leaders take a much larger share of visibility, reviews, and installs. That has a simple effect: merchants often stick with names they already know, especially when those apps have thousands of reviews behind them.
The broader store-wide numbers show how steep that climb is. Only 5.4% of all Shopify apps ever reach 100 reviews, and fewer than 1% make it past 1,000.
By contrast, larger and more spread-out categories like Analytics or Upsell & Cross-sell can still feel crowded, but no single app fully controls the space. That gives mid-tier apps more room to grow, especially when they focus on a clear merchant segment or a narrow use case instead of going straight at the biggest all-purpose players.
A longitudinal study of 55 functional categories found that about half were low-concentration, while about 20% were highly concentrated. It also found that larger categories were generally less concentrated. Put plainly: when the gap between the leaders and everyone else gets too wide, mid-tier apps have a much harder time gaining visibility without a sharp jump in rank or reviews.
These concentration patterns lead straight into the next issue: which events actually shift visibility share over time?
Rank Movement, Listing Edits, and Visibility Share Shifts
What Tends to Move Rank: Reviews, Ratings, and Listing Quality
Higher visibility share usually lines up with stronger ratings, fresh reviews, and clearer listings. Those signals matter because they affect visibility share, not just rank.
And the order matters. Listing edits can change keyword relevance and conversion rate. That can lead to more installs and, over time, more reviews. Those are the behavior signals algorithms tend to reward. Conversely, algorithms are increasingly sensitive to fake reviews and inorganic growth patterns.
One of the clearest signs of momentum is review velocity. As of September 17, 2026, Judge.me Product Reviews App added 341 reviews in a single week against a total of 44,548, while Shopify Flow added 200 and Kaching Bundles App & Upsells added 116. When those weekly gains keep stacking up, rank gains often stick too.
Before-and-After Patterns After Listing Changes
Rank movement after listing edits usually happens in stages, not in one big leap. Early indexing updates can cause small swings in the first 24–72 hours. But the more meaningful change tends to come later, based on whether the new copy actually changes merchant behavior.
Here’s the pattern that showed up in observed data:
| Change Type | Observed Rank Effect | Time Lag | Visibility Share Impact |
|---|---|---|---|
| Title & keyword edits | ±2–5 positions in targeted keyword clusters when relevance and conversion improve; minimal if cosmetic | 1–3 days for indexing; 1–3 weeks for changes in clicks, installs, and reviews | Gradual gains for specific keywords; may redistribute visibility without large net change |
| Description/body copy revamp | Moderate improvements where new copy clarifies benefits and lifts conversion; often improved stability rather than big jumps | 1–2 weeks for conversion changes; 3–6 weeks for compounded rank effects | More stable share, especially for intent-matched categories; can improve long-tail coverage |
| Pricing changes (trial/tiers) | Indirect rank gains via higher install conversion; volatility risk if churn rises | 2–6 weeks as review patterns update | Share growth in price-sensitive segments; total impact depends on retention and review sentiment |
| Creative refresh (screenshots/video) | Conversion-driven improvements; larger impact in complex or visual categories; limited effect if purely cosmetic | 1–3 weeks for conversion metrics to translate into ranking shifts | Incremental gains, especially on category and brand search terms |
The big theme here is lag. Edits affect visibility share only after search behavior changes.
A good example is pricing repositioning. Mipler – Advanced Reports cut its Basic plan from $14.99 to $9.99/mo on September 16, 2026.
How Competitor Movement Drives Rank Swings Over Time
In tight categories, even a small gain by one rival can move a lot of visibility share. An app can drop in rank even when nothing on its own listing changes. Category rank is relative, so if a competitor sharpens its listing, gets a burst of reviews, or starts advertising on your top keywords, your app may slide even if your team did nothing at all.
That effect gets stronger when the category is concentrated. One rival’s move can shift your share fast.
You can see this most clearly on volatile keywords. Keywords like "chatbot ia" (5.0 average position shift), "WhatsApp" (4.8), and "customer service" (4.5) show that swings of 4–5 positions in a single week are common in some niches. In a market like that, a Monday drop may have nothing to do with your team’s work. It may just reflect a competitor’s listing update or ad push from the week before.
That’s why trend tracking beats one-day snapshots. A single day’s rank is often just noise. Looking at 7-day or 30-day moving averages shows whether the shift is structural or short-lived. Trend data helps teams see whether share is moving because of their own changes or because a competitor made a play. AppJubilee's daily tracking helps teams connect ranking snapshots to competitor listing refreshes and pricing changes, which makes it easier to separate their own actions from category movement.
Growth Trends, Long-Tail Opportunity, and Developer Takeaways
Growth and Volatility Patterns by Category
Those rank swings lead to a bigger question: where can you still find steady growth?
Not every Shopify app category moves the same way over time. Stable categories, like sourcing or inventory, tend to have a lot of visibility concentrated in the top five to ten apps and smaller week-to-week ranking shifts. Higher-volatility categories, like AI and messaging tools, move much faster. In plain English, some categories feel more like a slow chess match, while others look more like a sprint.
That difference matters. High-volatility categories tend to reward frequent testing. Stable categories usually reward steady product work and listing updates over time. So if you're trying to size up a category, concentration and review velocity are the next signals to watch.
How to Read Long-Tail Opportunity Without Overestimating It
A big pool of low-review apps can look like open space, but that read is often too optimistic. The share of apps with fewer than 100 reviews works as a proxy for long-tail opportunity. A high share may point to a large long tail, but it can also signal weak demand or a market where a few leaders already own most of the attention.
The safer way to judge long-tail growth is to look at three things together:
- concentration
- review velocity
- rank stability
That filter helps you avoid mistaking long-tail size for actual opportunity.
Taken together, these patterns point to a few practical moves.
Key Lessons for Shopify App Teams
Three takeaways matter most: measure concentration before you invest, treat listing edits as only one lever, and keep tracking competitor moves. Categories where the top five apps control 60%–70% or more of visibility share are harder to enter, and your go-to-market plan needs to match that reality.
Listing edits tend to work best when they are paired with review generation, support upgrades, and real product improvements. And rankings can move even when your own listing stays the same. That's the part many teams miss.
AppJubilee's daily keyword tracking, competitor alerts, ranking snapshots, and GA4 and Shopify Partners integrations tie visibility shifts back to installs and paid conversions. That closed loop helps teams optimize for installs and revenue, not just visibility.
FAQs
What is a good visibility share?
A strong visibility share is often tracked with a blended metric like the AppJubilee AJ Score. If your score is 80+, that’s Grade A and usually means you’re leading your category.
Most apps land between 35–65. That leaves plenty of room to grow. If you’re below 35, that’s Grade F, which means competitors are taking most of the organic traffic your app could be getting.
That’s why weekly visibility checks matter. They help you spot ranking drops early, before they turn into a bigger traffic problem.
How long do listing edits take to affect rank?
High-impact listing fields like Titles and Search Terms are usually indexed within 7 days. But if you're looking for changes in rankings and install performance, give it 2 to 4 weeks.
That timing matters because small day-to-day shifts - like moving up or down by 1 or 2 spots - are often just noise. A one-day bump can look promising, then vanish the next day.
A better way to judge your edits is to look at trends over:
- 7 days
- 14 days
- 30 days
That gives you a much cleaner read on what changed and whether your updates are actually moving the needle.
How can I tell if rank changes are real?
Don’t overreact to one-day rank swings. Most of the time, they’re just noise or short-term personalization at work. A much better read comes from 7-day to 30-day trends.
AppJubilee helps you check whether a shift is real by lining up listing edits or competitor changes with performance data. If rankings, traffic, and install rates all move the same way over a two-week stretch, that change is probably meaningful.