
Fix Gaps in Shopify App Metrics with Partner Data
Use Shopify Partners as the source of truth for verified installs, billing, and payouts; join with GA4 to reconcile listing, trial, and revenue data.
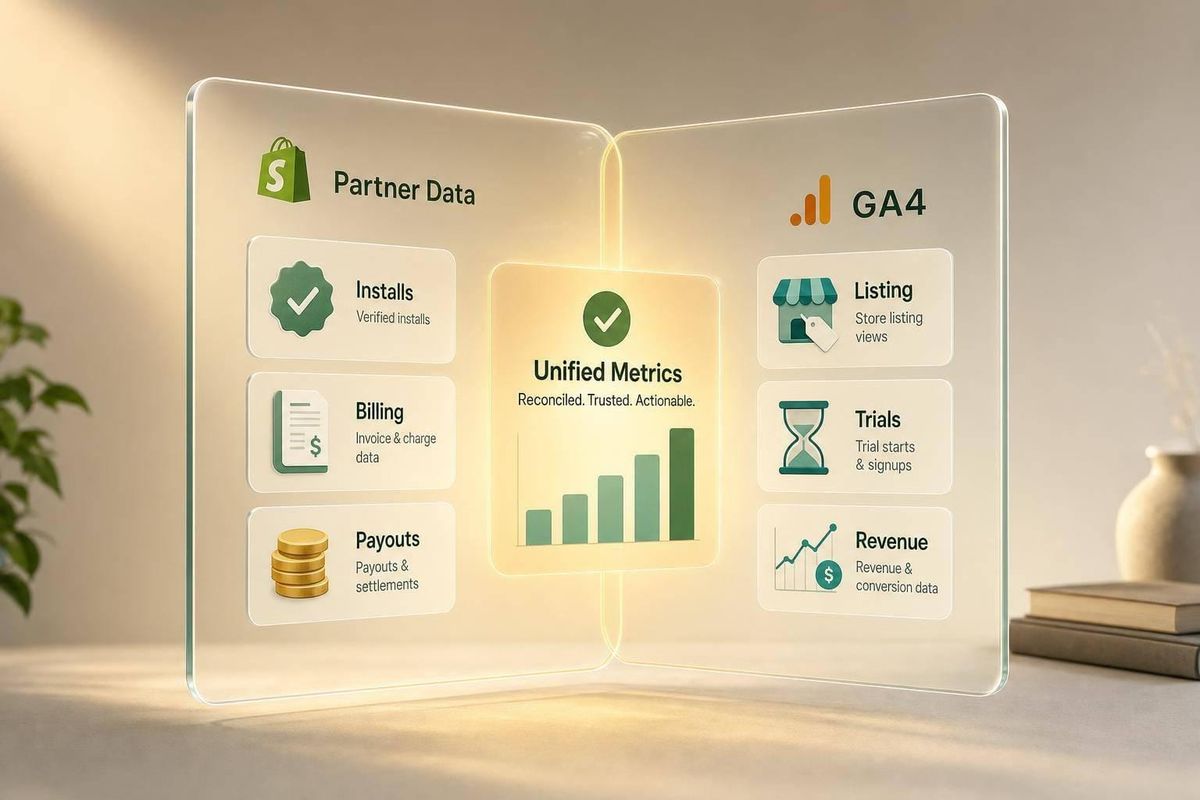
If your Shopify app numbers don’t match, I’d treat Shopify Partners as the system for installs, billing, and payouts. That one move clears up most reporting issues.
Here’s the short version:
- App Store analytics shows top-of-funnel activity, like views, clicks, and install starts.
- Internal analytics shows what happens after the app loads, so it can miss shops that install but never open the app.
- Shopify Partners shows completed install status, billing events, and payout data in USD.
That means I’d use Shopify Partners to check:
- Active installs vs. dropped-off install attempts
- Trial-to-paid paths by merchant and date
- Churn, refunds, upgrades, and downgrades
- Booked revenue vs. paid-out revenue
- Whether a listing change led to merchants who paid and stayed
A few facts stand out:
- Shopify can log an install start before the merchant finishes setup.
- Reinstalls can inflate new install counts if I don’t deduplicate by shop ID.
- Payout timing can lag booked revenue by days or weeks, so the same-day numbers may not match.
- Revenue in Shopify Partners is reported in USD, including paid and pending payouts after Shopify’s share.
Here’s the plain takeaway: one dashboard won’t tell the whole story. I need traffic data from GA4 or product analytics, then I need Shopify Partners to confirm merchant status and money data.
| Data type | Best place to check |
|---|---|
| Listing views, clicks, CTR | GA4 / App Store analytics |
| Verified installs and uninstalls | Shopify Partners |
| Trial and paid conversion | Shopify Partners |
| Revenue, refunds, payouts | Shopify Partners |
| In-app behavior | Internal analytics |
My rule is simple: use traffic tools for visits, and use Shopify Partners for merchants and money. That gives me one clean funnel from listing view to install, trial, payment, churn, and payout.
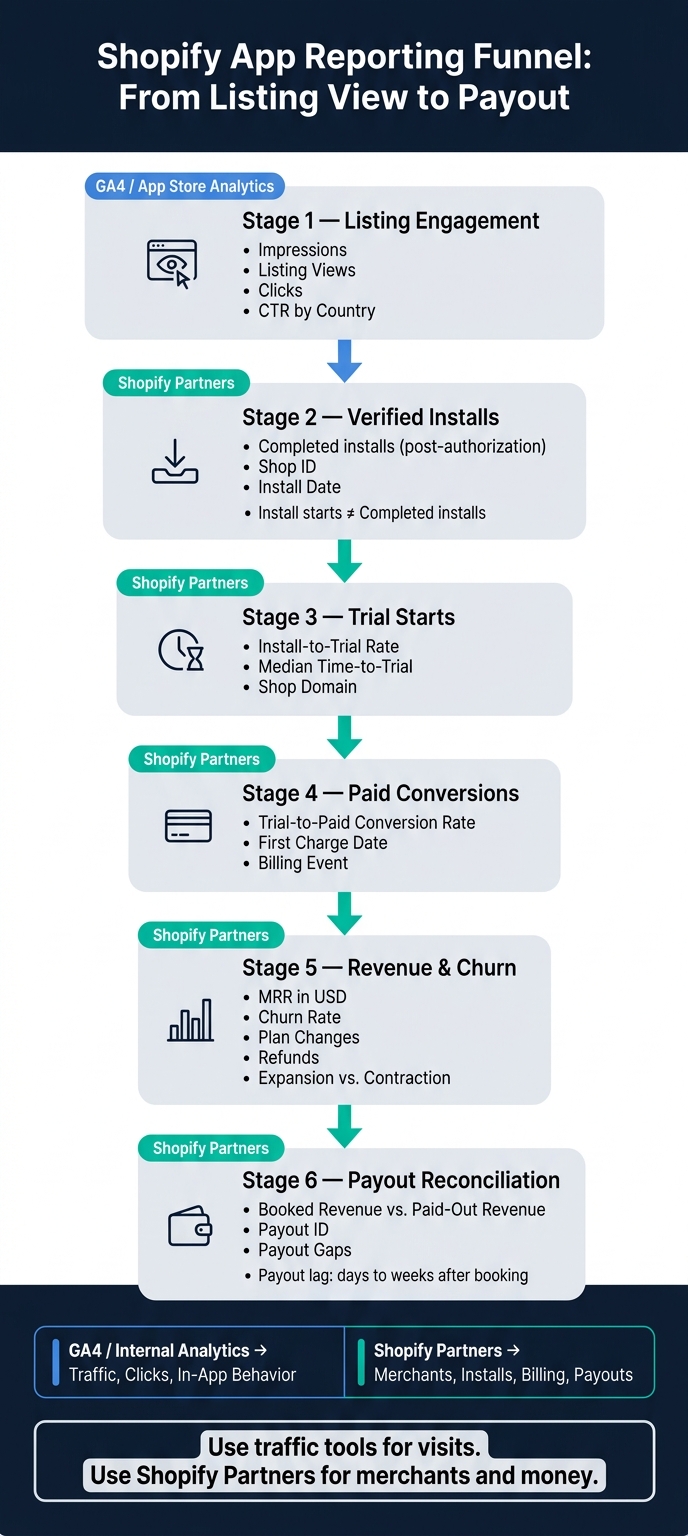
Shopify App Reporting Funnel: From Listing View to Payout
Common blind spots in Shopify app reporting
Shopify app reporting starts to fall apart when teams treat each funnel stage like the same event.
That usually creates gaps in three areas:
| Problem | What you see | Why it matters |
|---|---|---|
| Install counts don't match active apps | More installs in dashboards than in Partner records | Inflated acquisition and retention forecasts |
| Trial, churn, and plan changes are hard to track by cohort | No conversion or cancellation timeline per install group | Weak LTV modeling and inaccurate forecasting |
| Revenue and listing performance stay disconnected | Listing changes can't be tied to payout or churn data | Impossible to compare ASO tools to prove ROI or justify listing investment |
Install counts do not reflect actual active apps
A merchant can begin an install and still drop off before finishing it. And that’s where things get messy. Different systems log different steps in that flow, so the numbers often don’t line up.
Shopify Partners only records a completed install after Shopify authorization is done. Internal dashboards, on the other hand, often count activity much earlier. The result? Teams overcount the top of the funnel and miss what happened at the back unless they reconcile Partner records and deduplicate by shop ID and active status.
Reinstalls make the picture even murkier. A merchant who uninstalls and later reinstalls your app may look like a new install in one system, but appear as a returning merchant in Partner data. If you don’t deduplicate, acquisition numbers get padded and retention can look worse than it actually is.
Trial, churn, and plan changes are hard to track by cohort
Partner records show status. But if you want cohort analysis, that’s not enough. You need exported event data.
The default view won’t show how many merchants who installed in a given week started a trial within 7 days, converted to paid within 30 days, or churned before the first billing cycle. That timeline has to be built manually.
To get there, you need to export merchant and charge data and connect the cohort yourself. In plain terms, that means tying install date, trial start, first successful charge, cancellation, and any plan upgrades or downgrades to a merchant ID. Without that link, a spike in installs after a listing update can look like growth, even if those merchants churn before the first bill lands.
The subscription events that matter most for cohort accuracy are:
- trial start
- trial end
- paid conversion
- recurring charge
- refund
- cancellation
- reactivation
- upgrade
- downgrade
Each event needs to be tied to a merchant, a date, a plan type, and a USD amount before the data becomes useful for budgeting or LTV modeling.
Revenue and listing performance stay disconnected
Listing data and billing data live in separate systems. Since those systems don’t share one common funnel, most teams can’t answer the question that matters most: did this listing change bring in merchants who paid and stayed?
That disconnect causes problems fast. Marketing teams end up optimizing for clicks instead of activated merchants. Product teams push listing updates that drive more traffic but pull in low-intent merchants who churn fast. Finance teams miss refund exposure because they can’t connect revenue, cancellations, and churn back to the same listing change.
Without one funnel, listing decisions turn into guesswork.
Shopify Partners closes these gaps by tying installs, charges, and payouts to the same merchant record.
sbb-itb-ce93587
Use Shopify Partners data as the source of truth
Use Shopify Partners as the source of truth for merchant status, billing, and payout data. Save internal tools for traffic and click behavior.
That split matters more than it may seem. If one system says a shop is active and another says it churned, your reporting gets messy fast. The clean fix is simple: let Shopify Partners own merchant and money data, and let GA4 or your product analytics own traffic behavior.
The table below shows where each metric should live:
| Metric | Internal Analytics | Shopify Partners Data | Source-of-Truth Choice |
|---|---|---|---|
| Active installs by shop | App DB flags, GA4 "active user" events | RELATIONSHIP_INSTALLED / RELATIONSHIP_UNINSTALLED events with shop ID and timestamp |
Shopify Partners |
| Uninstalls | Often missed or estimated | Exact removal events, including reason and merchant description | Shopify Partners |
| Trial-to-paid conversion | In-app events, application logs | Subscription status changes and charge events | Shopify Partners |
| Net revenue in USD | Internal billing records | Charge, credit, refund, and payout events | Shopify Partners |
| Traffic, clicks, CTR | GA4 / product analytics | Not available | GA4 / Internal Analytics |
| Listing-to-install conversion | GA4 for impressions and clicks | Confirmed install events | Both, joined by shop ID |
Validate installs, uninstalls, and active app timelines
Build active status windows from install, uninstall, deactivate, and reactivate events sorted by timestamp. Each install event opens an active period. Each uninstall or deactivation closes it.
This gives you a shop-level timeline you can trust, instead of guessing from app database flags or partial event logs. Because Partner event IDs are stable, you can re-run queries or backfill data without double-counting.
Map trials, subscriptions, and net revenue in USD
Use subscription status changes and charge events to mark trial start and paid conversion. Then use charge, credit, and refund events to calculate net revenue in USD, and reconcile that figure with payout events.
There’s one catch: booked revenue and paid-out revenue are not the same thing on the same day.
Shopify pays out on a fixed schedule. Earnings from the 1st–10th of the month are paid 5 business days after the 15th. Earnings from the 11th until 5 days before month-end are paid 5 business days after month-end. The final 5 days are paid 5 business days after the 15th of the next month.
So your dashboards should clearly separate:
- Booked revenue from charge events
- Paid-out revenue from payout events
- Any lag between the two
If you blend those numbers together, finance and growth teams can end up talking past each other.
Build historical cohorts from exports or API data
Export Current merchants, Earnings, and History as CSV files from the Partner dashboard to group shops into monthly cohorts and calculate retention, churn, and conversion rates.
If your team wants more control, pull the Partner API's historical events data by event type and date range, then store it in your warehouse.
At a minimum, store these fields:
- shop ID
- domain
- app ID
- event type
- date
- event ID
- USD amount
That base table makes joins much easier. You can line up verified merchant outcomes with listing changes, product behavior, and traffic data without stitching together shaky records from different systems.
With clean Partner records in place, you can join them to product analytics and listing data in the next step.
Connect Partner data to product analytics and listing performance
Once your shop IDs are mapped, you can join Partner records with product events and listing metrics to follow the full path from first view to payout.
Reconcile installs, trials, and payouts in one funnel
With a shop-level table ready, the next move is to join it with product and listing data. Here’s a practical workflow:
| Step | Data Source | Key Fields | Output Metric |
|---|---|---|---|
| Listing engagement | Shopify App Store dashboard | Date, impressions, listing views, country | Listing view rate; CTR by country |
| Verified installs | Shopify Partners API | App ID, shop ID, install date | Listing-view-to-install rate; net new installs |
| Trial starts | Shopify Partners events | Shop ID, trial start date, shop domain | Install-to-trial rate; median time-to-trial |
| Paid conversions | Shopify Partners + internal onboarding events | Shop ID, first paid charge, billing event | Trial-to-paid conversion rate |
| Revenue and churn | Shopify Partners billing and refund events | Shop ID, plan changes, charge amounts | MRR in USD; churn rate; expansion vs. contraction revenue |
| Payout reconciliation | Shopify Partners payout events | Payout ID, net revenue, payout date | Payout match rate; payout gaps |
The weak spot is the join key. Use shop ID, not domain. Domains can fail you because of case changes, subdomains, and custom domains. Once that key stays the same across systems, the joins stick and double-counting drops off.
Measure listing changes against verified downstream results
After the funnel is joined, you can check whether listing edits changed what happened next. Tag each listing change by date, then compare pre- and post-change cohorts across trial rate, conversion rate, and 90-day revenue per install.
That keeps the chain clear: listing edit → cohort join → verified install, trial, and revenue outcome.
Use AppJubilee to bring ASO signals and Partner data together
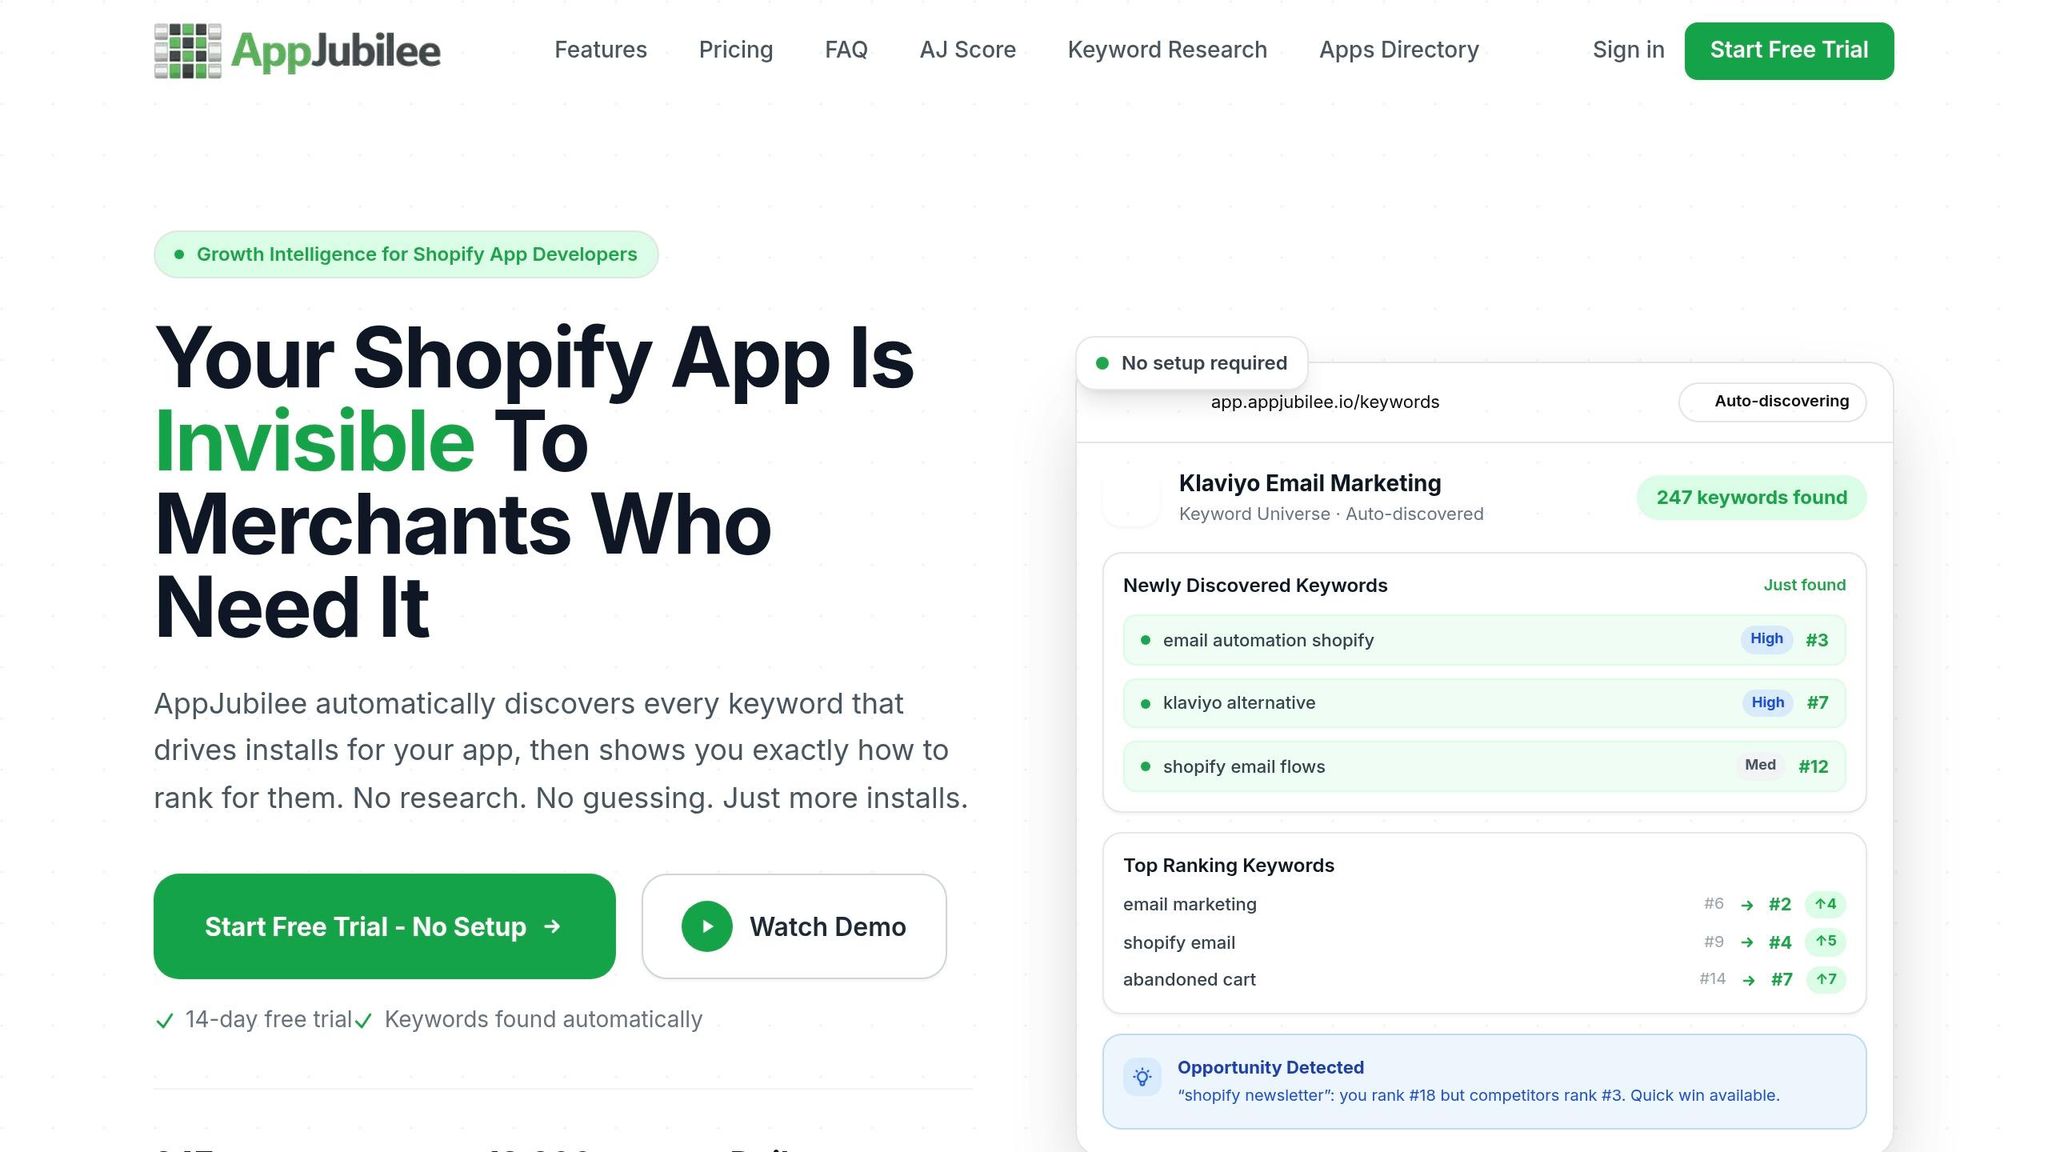
AppJubilee (appjubilee.io) connects GA4 and Shopify Partners through integrations, so keyword rankings, listing change impact, and verified install and revenue data sit in one place.
| Without Partner Integration | With Partner + AppJubilee Integration | |
|---|---|---|
| Install tracking | Estimated from clicks | Verified daily counts from Shopify Partners |
| Listing change impact | Guesswork based on total installs | Rank and install changes by edit date |
| Keyword attribution | Broad guesses | Installs mapped to specific search terms and traffic sources |
| Review impact | Qualitative sentiment only | Rank movement after product reviews |
That gives you one view for keyword movement, listing edits, installs, and revenue.
Conclusion: Build reporting you can trust
Growth calls are only as good as the data behind them. When installs, trials, subscriptions, and payouts sit in separate reports, it's easy to get the wrong read on what's working - and make expensive decisions from partial numbers.
Shopify Partners solves that by acting as the source of truth. It gives you verified install and active-install counts, trial-to-paid progression, and payout-level revenue. That makes it much easier to see whether your app is actually growing or just pulling in top-of-funnel activity.
That same verified data makes listing analysis more dependable too. The goal is one trusted funnel. Check listing changes against verified install, trial, and payout data before you call an edit a win.
The same idea applies to ASO. AppJubilee connects Shopify Partners and GA4 so keyword rankings, listing changes, and revenue outcomes stay in one view.
The rule here is simple: treat installs, trials, subscriptions, revenue, and payouts as one connected system, not a set of separate dashboards. Once those pieces line up, pricing, onboarding, listing, and budget decisions rest on evidence. That's how you move Shopify reporting from estimates to proof.
FAQs
Why don’t my Shopify app install numbers match?
Shopify app install numbers can look all over the place when you can’t see how listing edits, ranking changes, and competitor moves affect merchant behavior. Without one place to track it all, it’s tough to know what’s driving install growth and what’s just noise.
When you connect your Shopify Partners account to AppJubilee, you can sync daily install and uninstall counts and line them up with ranking movement and listing changes. That gives you a much clearer view of why numbers go up or down.
What should I treat as the source of truth?
Use your Shopify Partners data as the main source of truth for actual install and uninstall counts.
AppJubilee adds context around ranking trends and listing performance. When you connect it to Shopify Partners, you can tie those trends back to verified install impact. That gives you a clearer picture of which listing updates and keyword shifts are driving growth.
How do I connect listing changes to revenue?
Link your Shopify Partners account in AppJubilee by going to Settings, choosing Integrations, and clicking Connect Shopify Partners.
Once the sync is done, head to the Listing Changes page. There, you can compare past listing updates against daily install and uninstall counts.
That gives you a simple way to spot which listing edits line up with install trends - and which ones may be affecting revenue.