
Partner API with GA4 for App Store Analysis
Tie GA4 traffic to Shopify Partners API installs to map the install funnel, find channel leaks, and improve listing conversions.

If I want to know which traffic sources lead to Shopify app installs, I need both GA4 and the Shopify Partners API. GA4 shows how people arrive, what they view, and whether they click toward install. The Partners API shows whether the install happened and whether the app was later removed.
Here’s the short version:
- I use GA4 for sessions, source/medium, campaigns, landing pages, and engagement.
- I use the Shopify Partners API for confirmed installs and uninstalls.
- I map both data sets by time, shop/app identifiers, and install events.
- Then I review the funnel: listing view → install click → confirmed install.
- After that, I look for weak points by channel, landing page, device, and keyword using Shopify app store optimization tools.
- Last, I track listing edits week by week and month by month to see what changed. This process is easier when you use Shopify app keyword research to monitor how these changes impact your rankings.
That matters because traffic alone can mislead. A listing can get plenty of visits and still miss installs. And benchmark data in the article shows the average Shopify app converts 19.34% of listing visits into installs, while top-quartile apps reach 30.67%. So if my traffic looks fine but installs stay low, I know to check the gap between visit and install.
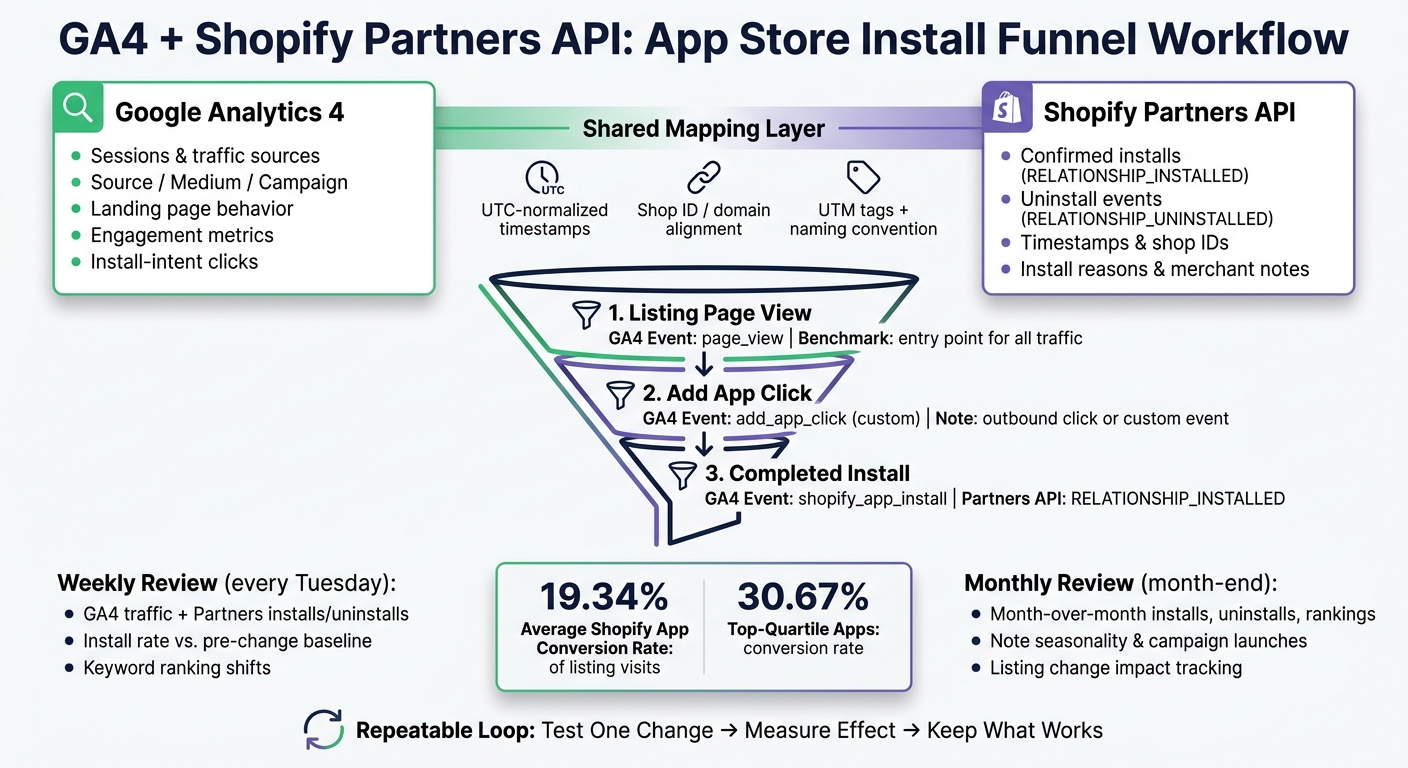
GA4 + Shopify Partners API: App Store Install Funnel Workflow
Quick comparison
| Source | What I get | What I do not get |
|---|---|---|
| GA4 | Sessions, attribution, landing pages, engagement, install-intent clicks | Confirmed installs |
| Shopify Partners API | Install and uninstall events, timestamps, shop relationship data | Traffic source or campaign data |
In plain terms: GA4 explains the path. The Partners API confirms the result.
To make the setup useful, I need clean UTM tags, a shared naming system, UTC-normalized timestamps, and a simple reporting loop. Then I can spot which channels bring installs, which landing pages fall short, which keywords bring the wrong visitors, and whether a listing update helps or hurts.
sbb-itb-ce93587
Step 1: Connect GA4 and Shopify Partners Data for Your App Listing
Before you join anything, set up GA4 and the Shopify Partners API for the same app. That gives you two sides of the picture:
- GA4 shows traffic and session attribution
- Partners API confirms installs and uninstalls
That split matters. GA4 tells you where people came from. The Partners API tells you what they actually did.
Set up GA4 tracking for your Shopify App Store listing
Start by creating a dedicated web data stream for your app listing in GA4. Give it a clear label so you don't mix it up with your main site or docs. Then copy the Measurement ID from Admin → Data Streams → Web. It will look like G-XXXXXXX.
Next, open the Shopify Partner Dashboard, go to your app, and paste that Measurement ID into the Tracking information area in your listing settings.
Shopify's App Store install funnel uses GA4 Measurement Protocol, which means install events are sent server-side from Shopify's own setup to GA4. To turn that on, create a Measurement Protocol API secret in Admin → Data Streams → select your web stream → Measurement Protocol API secrets → Create.
Then add that secret in Partner Dashboard → Tracking information. Keep it in a secrets manager, not in a doc or spreadsheet.
Access Shopify Partners API install and relationship events
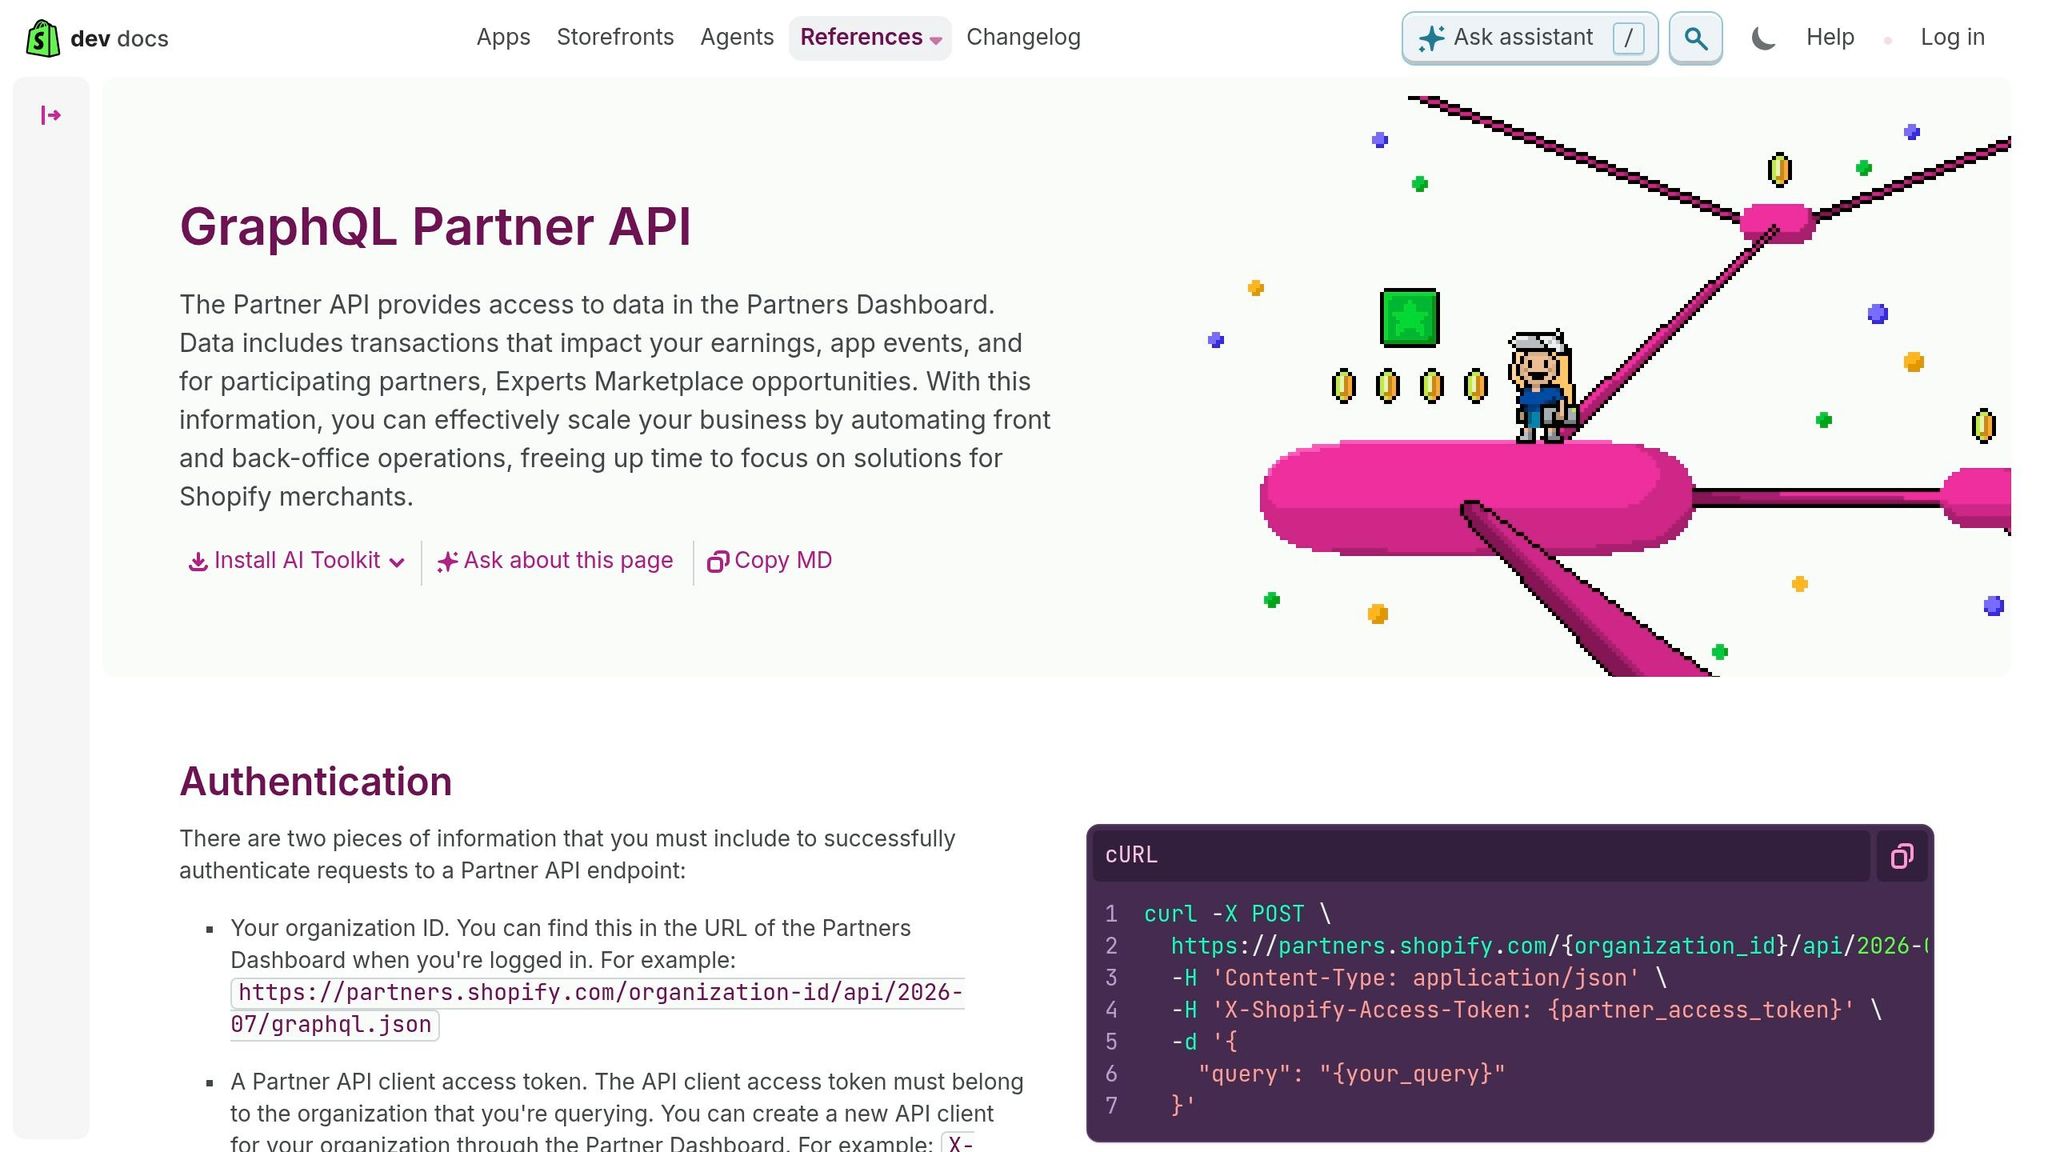
On the Partners API side, use API credentials tied to your Partner organization and the app you're reviewing. The token needs permission to read app relationships and events.
Track these two event types:
RELATIONSHIP_INSTALLEDRELATIONSHIP_UNINSTALLED
These events include fields like occurredAt, app ID, shop ID, and, for uninstall events, the reason and merchant note. Query App.events with filters for RELATIONSHIP_INSTALLED and RELATIONSHIP_UNINSTALLED.
Run this pull daily so your install data stays current.
Those confirmed installs and uninstalls become the conversion and churn signals for the funnel you'll build next.
Build a source mapping table before reporting
GA4 and the Partners API don't speak the same language out of the box. Field names differ. IDs differ. Timestamps differ. So before you report on anything, build a mapping table.
This is the piece that lets GA4 traffic data line up with confirmed install events from Shopify.
| GA4 Field | Shopify Partners API Field | Notes |
|---|---|---|
event_name (e.g., app_install) |
event_type (e.g., relationship_installed) |
Normalize naming before joining |
event_timestamp |
occurredAt / installed_at |
Normalize both to UTC |
user_id / client_id |
shop_id / shop domain |
Use one format consistently |
app_id (custom param) |
app.id |
Set as a custom dimension in GA4 |
source / medium / campaign |
Derived from GA4 session | Partners API has no native source field |
page_location |
Listing URL | Confirms the entry point for the session |
One thing to keep straight: source, medium, and campaign exist only in GA4. The Partners API can confirm that an install happened, but it does not provide native attribution data.
That's why the mapping table matters so much. It makes the dependency plain and helps prevent a common mistake: treating Partners API data as if it can stand on its own for attribution.
Once those fields line up, you can combine installs and sessions into one funnel in GA4.
Step 2: Set Up Source Mapping and Install Funnels in GA4
Now it’s time to turn that mapped data into reports you can actually use. The goal is simple: tie visits back to the right source, compare channels side by side, and see where people fall out of the install path.
Map source, medium, campaign, content, and landing page dimensions
Tag every App Store URL with utm_source, utm_medium, and utm_campaign. Add utm_content when you need to separate one ad, email, or placement from another.
Use one lowercase naming system with no spaces. That stops entries like Facebook and facebook from showing up as two different rows in GA4. It also makes reporting much easier to compare over time.
A shared campaign registry or lookup sheet helps a lot here. If email, paid, partner, and content teams all use the same labels, your reports won’t turn into a mess. In GA4, standardize source, medium, campaign, content, and landing page so each visit maps back to the right acquisition effort.
| Channel | utm_source |
utm_medium |
utm_campaign |
utm_content |
|---|---|---|---|---|
| Email newsletter | newsletter |
email |
<campaign-name> |
<email-variant> |
| Paid social | facebook |
paid_social |
<campaign-name> |
<ad-creative> |
| Partner referral | <partner-name> |
affiliate |
<partner-program> |
<placement> |
| Blog / content | blog |
content |
<topic> |
<article-link> |
Use Landing page + query string for entry-page analysis. Use page_location when you need the full URL.
Define the install funnel from listing view to completed install
A practical Shopify App Store install funnel has three steps: listing page view, add app click, and completed install.
In GA4, the middle step is usually tracked as an outbound click or a custom event. Mark the click and install as key events so you can spot where the funnel leaks. Shopify Partners API exposes RELATIONSHIP_INSTALLED and RELATIONSHIP_UNINSTALLED events for confirmed installs and uninstalls.
If views are high but clicks are low, that usually points to one of three things: weak relevance, bad tracking, or friction in the install flow.
Validate funnel accuracy with a comparison table
GA4 and the Partners API won’t match exactly. That’s normal. What matters is whether the gap stays steady.
Use this table to catch tracking gaps before you make changes to the listing.
| Funnel Step | GA4 Event | Partners API Event | Common Mismatch Cause |
|---|---|---|---|
| Listing view | page_view |
N/A | Tracking configuration issues or missing pageview data |
| Install intent | add_app_click (custom) or outbound click |
N/A | Missing click tracking, ad blockers, or browser privacy settings |
| Completed install | shopify_app_install |
RELATIONSHIP_INSTALLED |
Consent blocking or server-side timing differences |
| Uninstall | Custom event (optional) | RELATIONSHIP_UNINSTALLED |
GA4 rarely captures this; Partners API is the source of truth |
Use this check to separate tracking noise from actual conversion loss.
Review source/medium consistency, event order, and channel drop-off every week. If GA4 is lower, look for blocked scripts, missing tags, or drop-off before the final event. If the Partners API trails GA4, treat it as a timing gap first. Also, line up time zones before comparing daily counts.
Once the funnel is clean, move to landing pages and keyword traffic.
Step 3: Analyze Landing Page Behavior and Keyword Traffic Patterns
Review landing page engagement by traffic source
Start with the funnel gaps from Step 2. They tell you which traffic sources and devices deserve a closer look.
Once the funnel is mapped, compare traffic sources by engagement and installs. In GA4, use the Landing page and Traffic acquisition reports, then add Session source/medium and Device category. Pay attention to engagement rate, average engagement time per session, engaged sessions, and your install conversion rate.
In a Free-form Exploration, set Landing page, Session source/medium, and Device category as row dimensions. Then add sessions, engagement rate, average engagement time, and install conversions as metrics. Sort by sessions and flag rows where installs lag.
That’s where the story starts to show up. If organic App Store traffic on desktop converts much better than referral traffic on mobile, you likely have a mobile listing issue. In that case, test changes like:
- shorter copy
- clearer screenshots
- a more direct opening headline
After you review source performance, look at whether search terms are sending the right visitors.
Track App Store search terms and keyword intent signals
Keyword traffic doesn’t all mean the same thing. Some terms bring curious browsers. Others bring people ready to install. So compare volume against engagement and installs.
If keyword data is flowing into GA4 through custom events or URL parameters, build an Exploration with keyword as a dimension and filter it to your listing’s landing page. Add sessions, engagement rate, CTA click events, and install conversions as metrics.
Two patterns usually stand out fast:
- High-volume, low-conversion keywords - broad terms like "marketing app" or "analytics" that drive traffic but weak installs. Your listing may not be specific enough for that intent, or the app may simply not fit that query well.
- Low-volume, high-intent keywords - specific terms like "Shopify post-purchase survey" or "GA4 Shopify app analytics" that bring fewer sessions but convert well. These terms show the language and features that click with your best-fit users.
Once you spot those two groups, use them. High-intent terms should appear in your listing title, subtitle, and above-the-fold description. Broad terms with weak conversion are worth a second look. If the app doesn’t solve that query well, pulling back on those keywords can cut wasted traffic and improve conversion rate.
If rankings moved before sessions moved, bring rank tracking into the picture to isolate the cause.
Use AppJubilee to connect rankings, listing changes, and traffic shifts
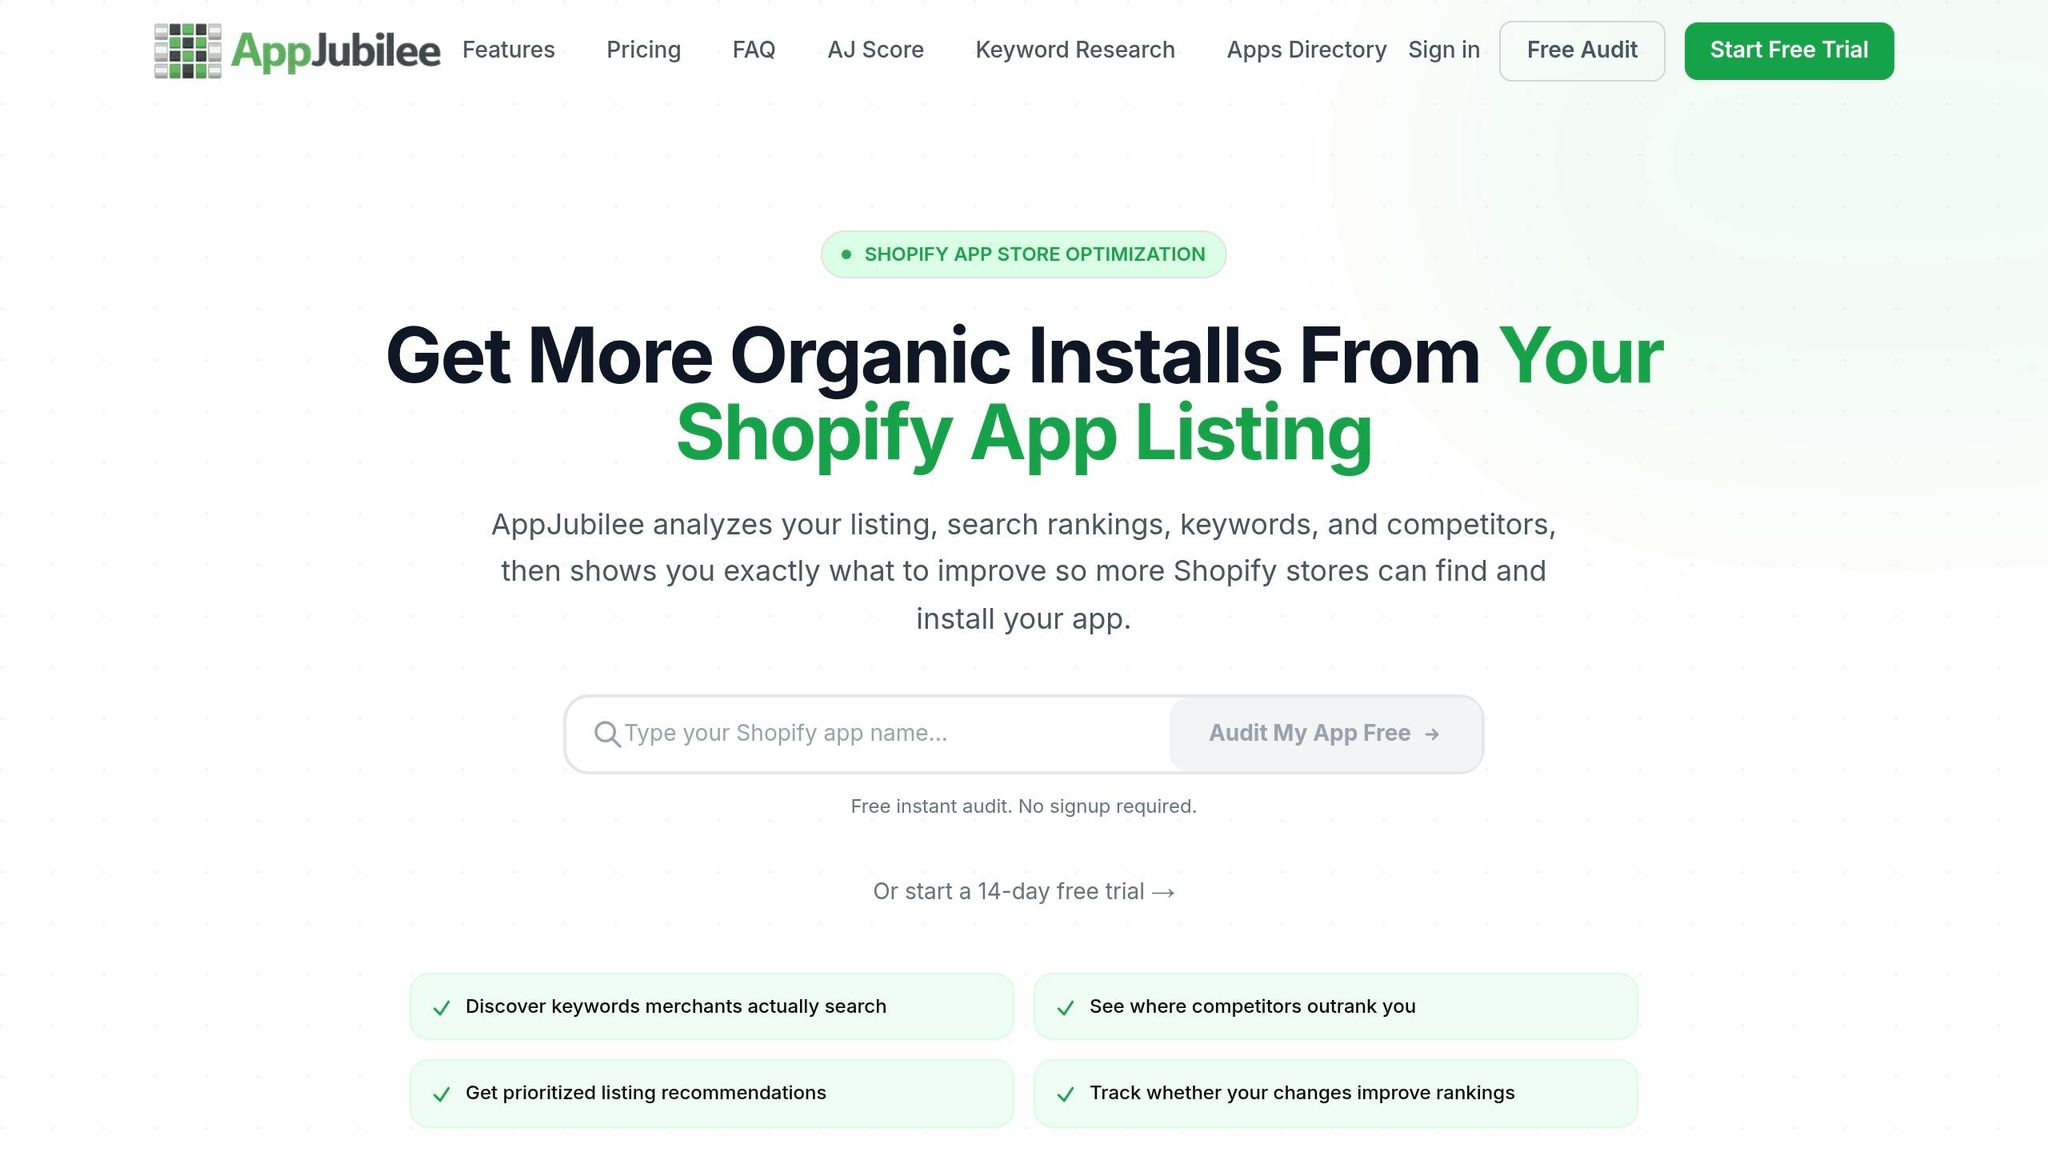
AppJubilee adds daily keyword tracking, ranking snapshots, listing-change impact tracking, competitor mapping, and GA4 plus Shopify Partners integrations, so you can tie ranking changes to traffic and install shifts. Use those signals to decide which listing updates to test next.
These patterns make it easier to see which listing updates should be tested next.
Step 4: Turn Combined Data into Listing Updates and Measurement Cycles
Prioritize listing updates based on conversion gaps
Start with the listing fixes most likely to move installs.
A simple way to do that is to line up your key metrics in one side-by-side view for the same date range and traffic sources: sessions, installs, uninstalls, install rate, and uninstall rate. That makes the biggest drop-off points in the install path much easier to spot. Flag any row where sessions are high but install rate sits below your install-rate benchmark, or where uninstall rate moves above your acceptable early-uninstall rate.
Then use the pattern behind the gap to decide what to change.
If traffic looks strong but installs are weak, tighten the title, subtitle, and screenshots. If engagement is high but installs still lag, sharpen the main benefit statement or improve intent match. And if a niche keyword converts well, pull that language into your listing copy.
Measure post-change impact with weekly and monthly reviews
Once the edit is live, the next job is simple: check whether the gap starts to close.
Log each change with the date, the exact edit, and the metric you expect to move. That gives you a clean record instead of a fuzzy memory of what changed and when. From there, stick to a weekly and monthly review rhythm.
Weekly (every Tuesday morning): Review the last 7 days of GA4 traffic and Partners installs/uninstalls. Watch for movement in install rate and uninstall rate against your pre-change baseline. If you use AppJubilee, check keyword ranking shifts during the same review.
Monthly (at month-end): Compare full calendar months, such as 07/01/2026–07/31/2026 vs. 08/01/2026–08/31/2026. Look at month-over-month movement in installs, uninstalls, and rankings. Add notes for seasonality or campaign launches that may explain shifts unrelated to your listing edits. AppJubilee's listing change impact tracking can help connect specific edits to ranking and traffic movement after the change.
Conclusion: A repeatable workflow for App Store analysis
Run the same loop each time: test one change, measure the effect, and keep the signals that hold up.
FAQs
How do I match GA4 traffic to confirmed installs?
Use AppJubilee’s combined GA4 + Shopify Partners sync to tie traffic data to confirmed app installs.
Connect Shopify Partners first. That pulls in daily install and uninstall counts for each app, which gives you the hard numbers on what happened each day.
Then connect GA4 to bring in traffic and engagement events. This helps you see how people found your listing and what they did before they installed.
From there, correlate GA4 traffic sources, such as:
- App Store search
- Category browse
- Google organic
- Direct
You can also map install-intent signals against confirmed daily install counts by source. That makes it easier to spot which channels drive installs, which ones bring low-intent visits, and how keyword performance lines up with actual install volume.
Why don’t GA4 and Partners API install counts match exactly?
GA4 and Shopify Partners API install counts can differ because they measure installs in different ways and sync on separate schedules.
Shopify Partners is the official platform record. GA4, on the other hand, tracks user interaction events based on how your property is set up.
So even when both are working as expected, the numbers may not match exactly. Their processing and timing are separate, which means small reporting gaps are normal.
Which metrics matter most when my listing gets traffic but few installs?
Focus on conversion and intent mismatch signals:
- CTR from the listing
- Conversion rate from page views to installs
- Installs and install intent by source
- Bounce rate
- 7-day uninstall spikes
Then compare keyword rankings and position-weighted visibility with install velocity over the last 7 and 30 days. That helps you see whether the keywords bringing in traffic actually line up with what users expected to find.