
10 Metrics Every Shopify App Developer Should Track
Visibility, engagement, and revenue metrics every Shopify app developer should monitor to boost installs, retention, and MRR.

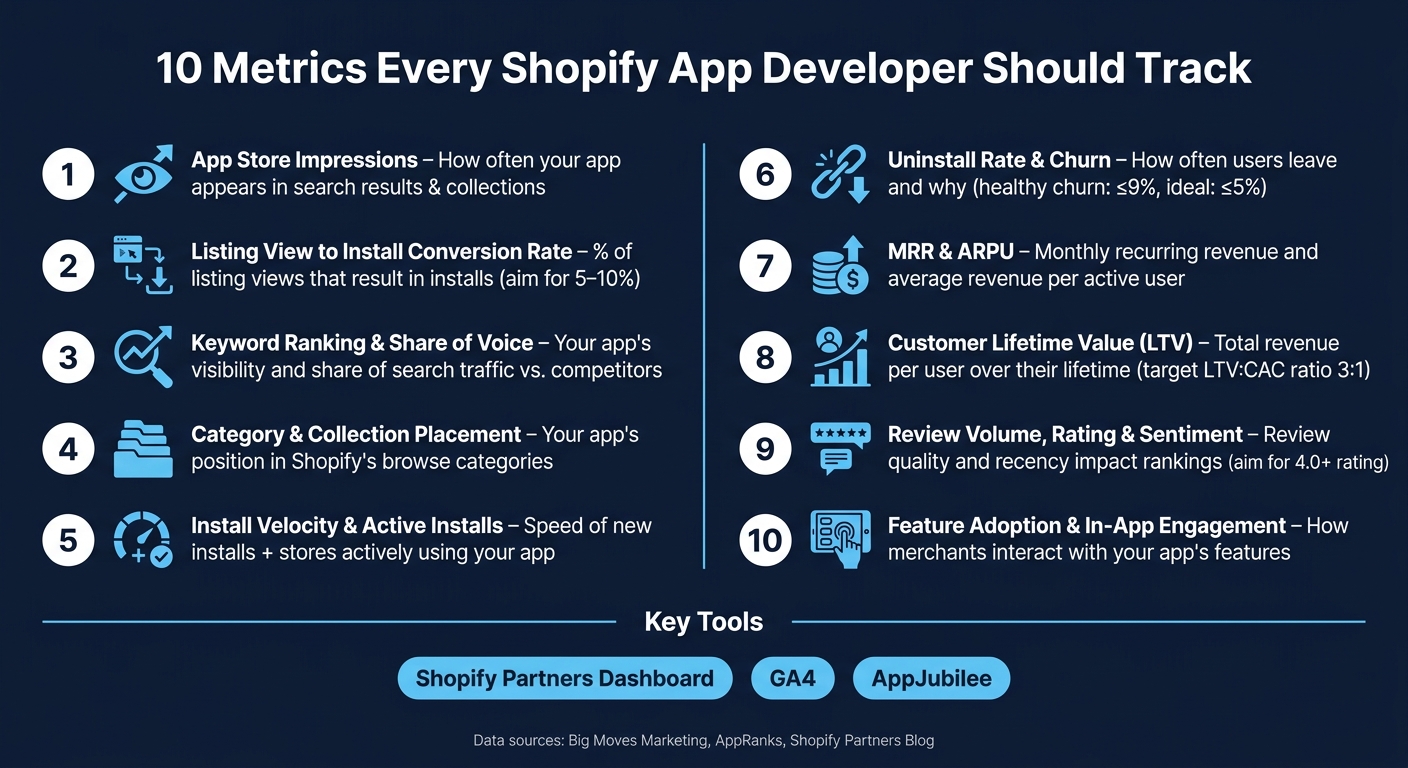
- App Store Impressions: Measures how often your app appears in search results or collections. Low impressions? Merchants aren’t finding you. Use tools like GA4 to optimize keywords and metadata.
- Listing View to Install Conversion Rate: Tracks how well your app listing turns views into installs. Aim for 5–10% and improve with better visuals, concise messaging, and trust signals like reviews.
- Keyword Ranking and Share of Voice (SoV): Focuses on your app’s visibility in search results. Optimize for function-based keywords and track rankings regularly.
- Category and Collection Placement: Highlights your app’s position in Shopify’s categories and collections. Placement impacts visibility and installs, so monitor and maintain momentum.
- Install Velocity and Active Installs: Tracks the speed of new installs and the number of stores actively using your app. Both metrics reflect growth and retention.
- Uninstall Rate and Churn: Measures how often users leave and why. Address onboarding issues and long-term value to reduce churn.
- Monthly Recurring Revenue (MRR) and Average Revenue Per User (ARPU): Indicates financial health. Break down MRR into new, expansion, and churned revenue for deeper insights.
- Customer Lifetime Value (LTV): Predicts how much revenue each user generates over time. Use it to refine pricing and acquisition strategies.
- Review Volume, Rating, and Sentiment: Reviews build trust and boost rankings. Respond to feedback and aim for consistent, high-quality ratings.
- Feature Adoption and In-App Engagement: Tracks how users interact with your app. Use event tracking to improve onboarding and highlight underused features.
Key Takeaway: These metrics collectively reveal how merchants find, use, and value your app. Use tools like Shopify Partners Dashboard, GA4, and AppJubilee to monitor and improve performance.
10 Metrics Every Shopify App Developer Should Track
Shopify App Expert: The Truth About Building a Successful App in 2025

sbb-itb-ce93587
1. App Store Impressions
App store impressions are the starting point of your app's success journey. They directly affect how many people view your listing and, ultimately, how many decide to install your app. An impression is counted every time your app shows up in search results, category pages, curated collections, or even on the Shopify App Store home page. Without impressions, there are no listing views; without listing views, there are no installs.
Impressions are incredibly helpful for diagnosing issues in your funnel. If impressions are low, it means merchants aren’t finding your app - this points to a visibility gap. On the other hand, if impressions are high but installs are low, that’s a conversion gap - your app is being seen, but the listing isn’t convincing enough to drive installs.
To dig into your impression data, you can use GA4 by connecting it through the Shopify Partner Dashboard. GA4 tracks URL parameters like surface_type, surface_detail, and surface_intra_position, which give you insights into where your traffic is coming from. For example:
surface_typeidentifies whether traffic comes fromsearch,category,home, orcollectionpages.surface_detailshows the specific search terms merchants are using.surface_intra_positiontells you exactly where your app appears on the page - being in position 1 versus position 10 can make a huge difference in how often merchants notice your app.
To boost impressions, focus on optimizing your app's metadata to align with what merchants are searching for. Shopify’s ranking algorithm prioritizes the app name, subtitle, and keyword tags over the long description. Keep your app name under 60 characters and use precise, intent-driven phrases. For instance, instead of generic keywords, aim for something like "post-purchase upsell popup" to better match merchant search intent.
"Higher rankings lead to more impressions, more impressions produce more installs, more installs generate more reviews, and more positive reviews boost rankings further." - Big Moves Marketing
This snowball effect shows why impressions need ongoing attention rather than a one-and-done setup. Tools like AppJubilee can help by tracking daily keyword rankings (or you can compare Shopify App Store Optimization tools to see how different platforms handle tracking), so you can see how tweaks - like updating your subtitle or adding a new keyword tag - impact your impressions. Once you’ve got a handle on impressions, the next step is turning those listing views into installs, which we’ll cover in the following section.
2. Listing View to Install Conversion Rate
Once merchants discover your app, the next step is to see how effectively your listing turns those views into installs. This is where the listing-to-install conversion rate comes into play. To calculate it, divide the number of installs by the number of unique listing page views during a specific timeframe, then multiply by 100. This percentage acts as a quality score, showing how well your listing communicates its value. For instance, if your listing receives 1,000 views and results in 60 installs in a month, your conversion rate would be 6%.
"Your conversion rate is the single most important efficiency metric - it tells you how effectively your listing persuades merchants who have already found you." - Big Moves Marketing
Conversion rates typically fall between 5% and 10%, though this can vary by category. If your rate is below 2–3%, it’s a clear sign that your listing may not be effectively communicating its value and needs improvement.
Improving your conversion rate involves more than just numbers - it’s also about presentation and messaging. High-quality visuals and concise, benefit-driven captions can make a big difference. For example, use the first screenshot to showcase your app’s main benefit with a focus on outcomes. Trust-building elements like reviews, star ratings, and the Built for Shopify (BFS) badge also play a significant role. Apps with BFS status see an average 49% boost in new installs within the first 14 days. Additionally, offering a free plan or trial can help reduce financial hesitation. Around 46% of Shopify apps use this strategy, allowing merchants to experience the app’s value before committing.
To track these metrics, you can use GA4 by monitoring the view_item event for listing views and the shopify_app_install event for installs. Tools like AppJubilee’s Listing Changes & Impact Analysis feature can help you connect specific updates - like new screenshots or a revised tagline - to changes in your conversion rate over time. Focusing on optimizing your listing’s conversion rate is essential before shifting your attention to broader metrics like revenue and engagement.
3. Keyword Ranking and Share of Voice
Once you've optimized conversions, it's time to focus on who’s actually finding your app. With a solid listing-to-install conversion rate in place, keyword ranking becomes the next critical piece. This metric shows where your app appears in Shopify App Store search results. Considering that 70% of all Shopify app installations come from direct searches, keyword ranking plays a huge role in your app’s visibility. It’s essentially the foundation for understanding how well your app attracts search traffic through both ranking and Share of Voice (SoV).
SoV goes beyond just ranking by measuring the percentage of total search traffic your app captures for targeted keywords, compared to competitors. Think of it as your app’s share of the search pie. For instance, if a keyword drives 5,000 clicks per month and your app gets 930 of those, your SoV for that keyword would be 18.6%.
Here’s a key insight: 83% of merchants use function-based search terms - like "shipping labels generator" - instead of brand names. This means your app’s visibility depends on optimizing for what it does, not just what it’s called. Including primary keywords in your app title can make a big difference, with apps ranking 10.3 positions higher on average when they do. However, overdoing it with keyword stuffing can backfire, dropping install rates by 23% due to a poor user experience and algorithm penalties.
"Shopify App Developers know how difficult it is to understand which keywords are working, and where your installs are coming from." - Dylan Pierce, Developer
Tools like AppJubilee’s Keyword Universe make tracking easier by providing daily keyword ranking data and competitor visibility insights. This helps you identify where your app is performing well and where it might be buried in search results. Monitoring these metrics weekly, alongside install trends, allows you to connect ranking shifts with growth opportunities. Focus on ranking for specific long-tail keywords, such as "product review app for Shopify", which tend to convert at nearly double the rate of broader terms. Regularly keeping an eye on these keyword metrics ensures your app remains discoverable and competitive.
4. Category and Collection Placement
Keyword rankings might show how visible your app is in search results, but category and collection placement reveals how easily merchants can find your app while browsing. And that’s a big deal, considering that about 87% of Shopify merchants use third-party apps, installing an average of six apps per store. This browsing behavior opens up a huge opportunity for app developers.
There’s an important distinction to understand here: categories and collections. Categories are broad, algorithm-driven leaderboards, like "Reviews" or "Shipping Labels." On the other hand, curated collections, such as "Built for Shopify", act as endorsements. These collections serve as trust signals, making it much easier for merchants to hit that install button. As Letsmetrix explains, “Ranking well in official Shopify collections acts as a powerful trust signal and an indirect endorsement”.
The numbers back this up. Apps featured in "Built for Shopify" collections see a 49% increase in new installs within the first 14 days. Meanwhile, category leaders enjoy 5–10x the install velocity compared to the median app in the same category. That’s why securing a strong position in both categories and collections can make or break your app’s growth.
But how does the ranking algorithm work? It looks beyond just install counts. Factors like install velocity, recent reviews (and avoiding fake reviews), an average rating of 4.5 or higher, and how fresh your listing is all play a role. This means keeping your app listing updated and maintaining momentum are key to staying competitive.
It’s also worth noting that rank changes don’t happen overnight. In fact, they’re often lagging indicators. By the time your app drops in category rankings, the underlying signals - like slowing installs or outdated reviews - have already started to deteriorate. According to AppRanks, “Losing a featured slot often precedes a measurable install-velocity drop - typically visible in the next 3–10 days of velocity data”. This is why monitoring your category and collection positions over 7-day, 30-day, and 90-day windows is critical. Early warnings from these trends can help you act before a small dip turns into a bigger problem.
If you notice a rank drop, the first step is to figure out why. A sharp decline might mean a competitor has earned a new badge or made a major update to their listing. A slower drop, however, could point to weakening install rates or reviews that need attention. Tools like AppJubilee’s Listing Changes & Impact Analysis feature can be a lifesaver here, helping you connect rank shifts to specific events. That way, you can identify the issue and take action quickly to protect your app’s performance.
5. Install Velocity and Active Installs
Install velocity and active installs are two key metrics that reflect how well your app is performing. Install velocity tracks how quickly new merchants are installing your app over a specific time frame, such as 7, 30, or 90 days. Meanwhile, active installs measure the number of stores currently using your app that haven’t uninstalled it. Together, these figures help assess both growth momentum and user retention.
Install velocity holds significant weight in Shopify's ranking system. As AppRanks explains:
"Recent install momentum and a sustained rating at or above 4.5 are the two strongest single levers a developer can pull."
A boost in install velocity can trigger algorithmic recognition, leading to badges like "Bestseller" or "Rising Star." These accolades can, in turn, generate even more installs, creating a positive feedback loop.
Active installs, however, provide a more dependable measure of long-term success compared to raw download numbers. If your app has a high download count but stagnant or declining active installs, it could signal issues like onboarding difficulties or a failure to deliver ongoing value. High uninstall rates can also hurt your app's visibility within Shopify.
Keeping an eye on the relationship between these two metrics is essential. For instance, if install velocity is increasing but active installs remain flat, this could indicate retention problems rather than a lack of visibility. On the flip side, a steady base of active installs but slowing velocity might mean your app retains loyal users but struggles to attract new ones. Understanding these dynamics allows you to make informed adjustments to your app strategy.
To track these trends effectively, consider integrating your Shopify Partners data with analytics and monitoring tools. For example, AppJubilee's Shopify Partner Connection (available with Growth, Pro, and Agency plans) consolidates this data, helping you identify discrepancies between install velocity and retention before they impact your app's ranking.
6. Uninstall Rate and Churn
After examining install velocity and active installs, it’s equally important to keep an eye on losses through uninstall and churn rates. The uninstall rate tracks how often users remove your app, while the churn rate measures the loss of customers or revenue over a specific period. It’s worth noting that churn doesn’t always involve an uninstall - users might, for example, cancel a paid subscription and move to a free tier while still keeping the app on their device. Another critical metric is closed stores, which refers to merchants who shut down their entire Shopify business. These closures impact both active installs and revenue. Differentiating between losses due to closed stores and active uninstalls can help pinpoint whether the issue lies with your product or external factors beyond your control.
Timing is another essential aspect of uninstall data. Shopify breaks down uninstall timing into four categories: same day, 1–14 days, 15–90 days, and 91+ days. Same-day uninstalls often highlight onboarding friction, while uninstalls after 90 days may signal a decline in long-term value. Interestingly, about 14% of active users uninstall a Shopify app within the first 24 hours of installation. These patterns can uncover not only onboarding challenges but also broader issues with maintaining value over time.
Corey Haines, writing for the Shopify Partners Blog, emphasizes the importance of addressing churn:
"A high churn rate is unsustainable and has compounding effects over time. It's also indicative of potentially deeper rooted problems like product/market fit, onboarding, pricing, or customer expectations."
For a growing Shopify app, a healthy churn rate should remain at 9% or lower, with 5% or less being the ideal goal. Reducing churn can have a significant impact - retaining just 5% more customers can increase profits by as much as 95%. Tackling involuntary churn, such as losses caused by declined charges or frozen billing, is often more cost-effective than trying to acquire new users. Keeping an eye on charge declined and charge frozen events can provide an early warning of potential customer loss.
7. Monthly Recurring Revenue (MRR) and Average Revenue Per User (ARPU)
Let’s talk about the revenue your retained users bring in. Once you’ve got churn under control, metrics like MRR and ARPU give you a clear picture of your app's financial standing and help refine pricing strategies.
MRR, or Monthly Recurring Revenue, is the steady, predictable subscription income your app generates each month. It’s calculated on a monthly basis - even if a user pays annually. For example, a $1,200 annual subscription translates to $100 in MRR, not $1,200 in the first month. Corey Haines from Shopify sums it up perfectly:
"Recurring revenue is the lifeblood of any SaaS. It's what makes building a SaaS so appealing."
ARPU - calculated by dividing MRR by the total number of active customers - shows how much revenue, on average, each user generates. This metric plays a big role in shaping growth strategies. A low ARPU means you’ll need a huge customer base just to break even, which also limits how much you can spend on things like customer support or user acquisition. Corey Haines notes that achieving $1M ARR with a low ARPU demands a very large customer base. This makes ARPU a key link between user retention and financial performance.
To dig deeper into your revenue health, break MRR into smaller parts: New MRR, Expansion MRR, Churned MRR, and Contraction MRR. Tracking these individually helps you identify growth opportunities and spot revenue leaks. One handy way to measure this is the Quick Ratio: (New MRR + Expansion MRR + Reactivation MRR) ÷ (Contraction MRR + Churned MRR). A ratio between 1.3 and 4.0 indicates strong, sustainable growth.
For benchmarks, established Shopify apps aim for 5–8% monthly MRR growth, while newer apps target a more aggressive 10–15%. High-performing apps with over $100,000 in MRR grow 26% faster than their competitors. And since only about 13% of app installs convert to paying customers, focusing on ARPU optimization - through strategies like tiered pricing, feature bundles, or premium add-ons (e.g., priority support) - can often yield better results than simply chasing new installs.
8. Customer Lifetime Value (LTV)
Customer lifetime value (LTV) takes the insights from MRR and ARPU and extends them into the future, offering a broader perspective on customer profitability. While MRR and ARPU focus on the present, LTV answers the question: What is a customer worth over their entire relationship with your business? To calculate LTV, you can either divide ARPU by the monthly churn rate or multiply ARPU by the average customer lifetime in months. For instance, if your ARPU is $50 and your churn rate is 5%, the resulting LTV would be $1,000. The churn-based approach is especially helpful for newer apps as it relies on current cancellation data.
"LTV is used for many other metrics, not to mention is central to every decision you'll make from budgeting for customer acquisition cost (CAC) to pricing, further developing your app, and everything in between."
LTV also plays a crucial role in setting your customer acquisition cost (CAC) limits. A commonly recommended benchmark is a 3:1 LTV-to-CAC ratio - meaning for every $1 spent on acquiring a customer, you should aim to generate at least $3 in return over their lifetime. If the ratio drops below 3:1, it could indicate that high acquisition costs are cutting into your margins. Retention efforts are especially impactful here, as even a small 5% improvement in retention can increase profits by as much as 95%.
Addressing involuntary churn is one of the most effective ways to improve LTV. For example, failed payments - often overlooked - can cause customers to churn without intending to cancel. Monitoring and resolving failed payments can directly enhance LTV. Additionally, segmenting LTV by subscription type or plan tier can help identify your most profitable customer groups. If data shows that annual subscribers deliver significantly higher LTV than monthly ones, offering a larger discount on annual plans could encourage more users to switch, increasing profitability.
9. Review Volume, Rating, and Sentiment
Reviews play a massive role in building trust and improving your app's search ranking. They directly impact your app's visibility, user engagement, and even revenue potential. As Shopify explains, "Positive reviews make your app appear higher in Shopify App Store search results and category pages". But it’s not just about racking up a ton of 5-star ratings - Shopify’s rating system values quality over quantity.
"The overall rating isn't simply an average of star ratings; it's weighted to prioritize recent, useful, and trustworthy reviews." - Shopify
This means a pile of old 5-star reviews won’t carry as much weight as a steady stream of fresh, authentic feedback. A good goal to aim for is 100 reviews with detailed comments, maintaining at least a 4.0 rating. Hitting this milestone unlocks features like AI-powered review summaries, which typically appear within 14 days.
Reviews also provide valuable insights. Negative feedback can highlight bugs, confusing interfaces, or missing features. Liz Couto from Shopify emphasizes this point: "Constructive reviews are a goldmine of feedback on how to improve your app". Responding to reviews publicly is another important step - it shows potential users that you’re engaged and proactive. Merchants are notified when you reply, and many might even update their ratings after their issues are resolved.
When collecting reviews, ethics are key. Offering discounts or gifts in exchange for reviews can hurt your ranking. Here’s a quick guide to what’s acceptable and what’s not:
| Strategy | Acceptable Practice | Prohibited Practice |
|---|---|---|
| Language | "Let us know how we're doing." | "Leave us a positive 5-star review!" |
| Incentives | Providing excellent support to earn a review. | Offering discounts or free months for reviews. |
| Timing | After the trial period or resolving a support ticket. | During app installation or onboarding. |
| Placement | A non-intrusive section within app settings. | Pop-ups that interrupt the merchant's workflow. |
| Follow-up | Asking for a review update after fixing an issue. | Pressuring a merchant to change their review. |
To keep an eye on your app’s reputation, tools like AppJubilee's Review Tracking & Impact Analysis can help you monitor reviews and their impact on rankings. These insights will be crucial as you move into evaluating in-app engagement in the next section.
10. Feature Adoption and In-App Engagement
Tracking app installations is helpful, but understanding how users interact with your app is what truly drives growth. Metrics that focus on feature adoption and in-app engagement help you figure out which parts of your app users find valuable - and which ones they ignore.
"Engagement is a leading indicator of retention and revenue growth." - SaaS Insights
To dive deeper into user behavior, you can utilize the App Events API (introduced in May 2026). This tool allows you to log specific merchant actions - like onboarding_completed, bulk_edit_completed, or sync_failed - directly into your Shopify Dev Dashboard. Irene Zourdos from Shopify explains, "With App Events, you can now track merchant behavior inside your app and see it in the same Dev Dashboard where you monitor webhook deliveries, Function executions, and API calls". By unifying these insights, you can connect technical performance with user behavior, making it easier to address issues and refine user experiences.
Error tracking becomes especially impactful with this setup. For instance, in May 2026, a developer of an inventory sync app noticed a merchant triggering a csv_parse_error six times over two days while handling a bulk_import_failed event. After identifying that the merchant’s external system used non-standard column headers, the developer implemented a fix. This not only resolved the issue but also helped retain the user. Additionally, the developer used bulk_import_completed events as billing meters, automating invoicing in the process. This approach ties retention efforts directly to revenue generation.
Onboarding is another critical area to monitor. Early drop-offs often signal friction points that prevent users from reaching their "aha moment." For example, Smile.io encourages merchants to set their brand colors during onboarding, creating an immediate sense of personalization and investment in the app. Similarly, SEO Manager reduces drop-offs by featuring COO Rhian Beutler in a welcome video right after installation, fostering a personal connection with users.
Here’s a breakdown of key event categories to track and the insights they provide:
| Event Category | Example Event Handles | Insight Gained |
|---|---|---|
| Feature Usage | bulk_edit_completed, report_generated |
Highlights high-value features and adoption trends |
| Workflows | onboarding_completed, export_finished |
Identifies drop-off points in multi-step processes |
| Performance | sync_failed, api_timeout, rate_limit_hit |
Exposes errors and friction impacting user experience |
| Conversion | limit_hit, premium_viewed, milestone_achieved |
Shows readiness for plan upgrades |
| Billable | order_processed, email_sent, label_printed |
Links user engagement directly to revenue |
Once you’ve pinpointed underused features or areas of friction, you can take action. Strategies like in-app tooltips, guided product tours, and targeted email campaigns can encourage feature adoption. These efforts not only improve user engagement but also help reduce churn and increase revenue, tying back to the insights gained from earlier metrics.
Conclusion
Visibility, engagement, and revenue work together like pieces of a puzzle - each one offering a unique perspective on your app's growth. These metrics reveal how merchants find your app, how long they stay, and how much they spend. When viewed collectively, they provide a clear roadmap for smarter decision-making.
"Metrics act as the heartbeat of your business. They reveal whether your app is thriving or struggling and provide insight into user behavior, revenue growth, and app performance." - SaaS Insights
As we’ve seen, focusing on a balanced set of metrics - from impressions to churn - can help you identify opportunities and challenges. For example, a low churn rate might look great on its own, but it loses its meaning if your install velocity is dropping. Corey Haines, Founder of Swipe Files, sums it up perfectly: "Without context, metrics can become misleading vanity metrics."
To simplify your process, zero in on two or three key metrics at a time - whether it’s visibility, retention, or revenue - and analyze them daily, weekly, and monthly. Tools like AppJubilee make this easier by tracking everything from keyword rankings and competitor activity to review trends and ad performance - all in one place. By focusing on the numbers that matter most, you can make data-driven decisions to boost visibility, improve engagement, and grow revenue. The developers who succeed aren’t necessarily the ones with the most features - they’re the ones who truly understand their numbers.
FAQs
Which 2–3 metrics should I prioritize first?
Start by looking at app usage and retention rates - these metrics reveal how engaged users are and highlight the ongoing value your app delivers. After that, shift your attention to Monthly Recurring Revenue (MRR), which helps you gauge your app's financial stability and growth trajectory. Together, these metrics offer a clear picture of user behavior and revenue trends, giving you essential insights into your app's overall performance.
How do I track installs and listing views in GA4?
To monitor installs and listing views in Google Analytics 4 (GA4), connect GA4 with Shopify through the Shopify Partner Dashboard. Simply input your GA4 measurement ID in the Tracking Information section. Once set up, GA4 will track metrics such as listing views (when users click to view your app) and installs (if tracking is properly configured). By pairing GA4 data with Shopify’s attribution reports, you can gain a clearer understanding of your traffic and install trends.
What’s the best way to tell churn from store closures?
To distinguish churn from store closures, focus on tracking the merchant churn rate - this shows the percentage of merchants who either stop selling or shut down their stores during a given time frame. In contrast, store closures are typically spotted through indicators such as direct store deactivations or extended periods of inactivity.