
Tracking App Installs with Shopify Partners
Track Shopify App Store installs with the Partner Dashboard and GA4 to identify sources, onboarding issues, and trends.
If you're building apps for the Shopify App Store, understanding where your installs come from is critical for growth. The Shopify Partner Dashboard and Google Analytics 4 (GA4) make this process easier by providing tools to track installs, analyze trends, and identify the most effective marketing channels.
Here’s a quick breakdown of what you’ll learn:
- Use the Shopify Partner Dashboard to monitor installs, uninstalls, and merchant growth.
- Integrate Google Analytics 4 (GA4) to track install sources and user behavior.
- Focus on key metrics like Time to Uninstall to spot onboarding challenges.
- Combine Shopify and GA4 data for deeper insights into traffic sources and trends.
Setting Up Shopify Partners for Install Tracking
How to Track Shopify App Installs: Partner Dashboard + GA4 Setup
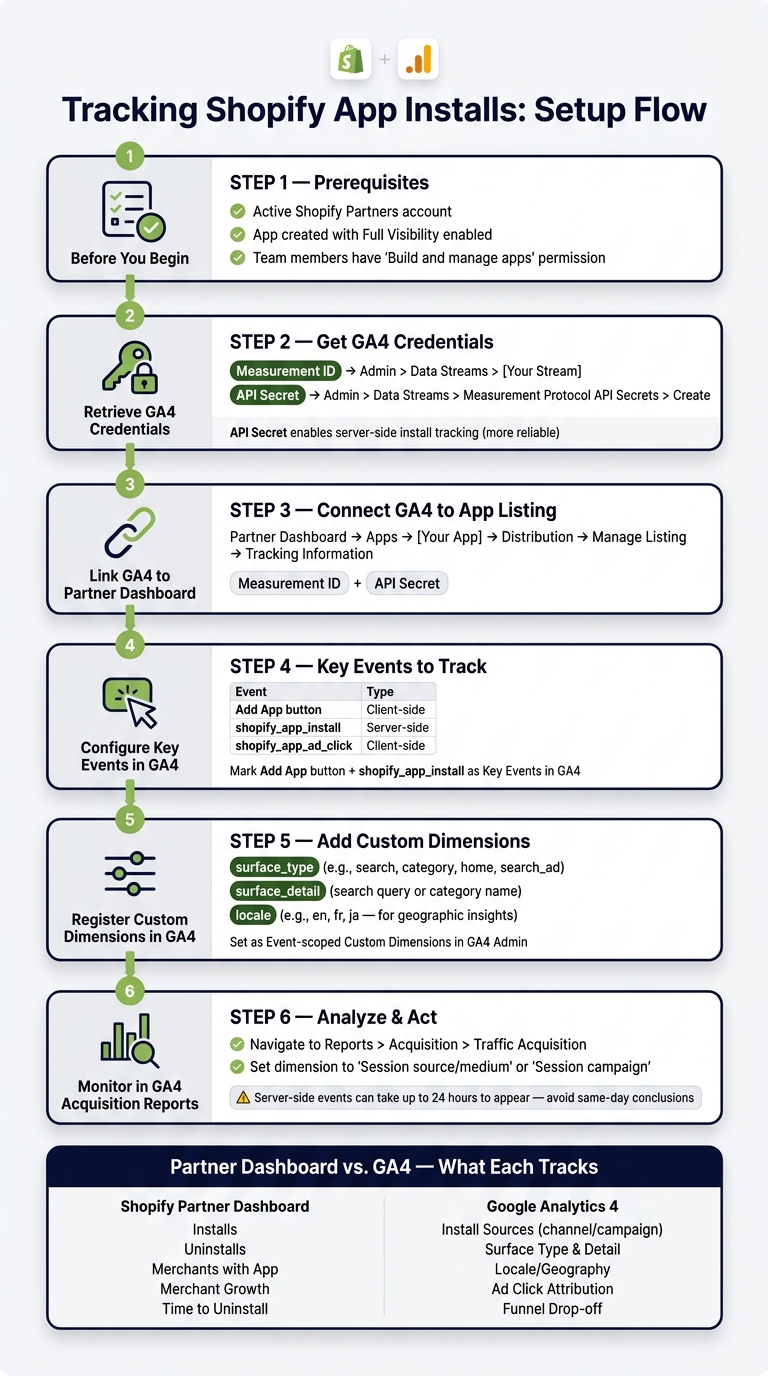
What You Need Before You Start
Before you can track app installs, there are three things you'll need to have ready:
- A Shopify Partners account: Make sure your account is active.
- At least one app created in your account: The app doesn't need to be live, but only apps with full visibility will show up in the Shopify App Store search results and category pages.
- Proper permissions for team members: Team members must have the "Build and manage apps" permission to access or configure app analytics.
If you want to go beyond Shopify's built-in metrics and track traffic sources, you’ll also need a Google Analytics 4 (GA4) Measurement ID. For full-funnel tracking - capturing server-side install events rather than just button clicks - you’ll need to generate an API secret in the GA4 interface.
Once these steps are complete, you're ready to access your analytics dashboard.
How to Access the Analytics Dashboard
To get started, log in to your Partner Dashboard. From there:
- Click on Apps in the sidebar.
- Select the app you want to analyze. This will take you to the app's Overview page, which serves as your main hub for install metrics.
For a detailed log of install and uninstall events, go to Insights > App history in the sidebar. If you want to set up traffic source tracking, navigate to Distribution > Manage listing. Here, you can input your GA4 Measurement ID or Facebook Pixel ID.
Key Metrics to Watch
Once inside the dashboard, focus on these critical metrics:
| Metric | What It Measures |
|---|---|
| Installs | Number of installs recorded after merchant OAuth approval |
| Uninstalls | Total number of app removals during the selected time period |
| Merchants with your app | Active stores currently using the app (includes paid, trial, staff, or dev stores; excludes canceled or frozen stores) |
| Merchant growth | Cumulative growth in active stores with the app installed over a specific date range |
| Time to uninstall | Breakdown of uninstall timing: same day, 1–14 days, 15–90 days, or 91+ days after install |
| Add App button (Event) | Tracks when a merchant clicks "Install" on your app's listing page |
One metric to keep an eye on is Time to uninstall. If a significant number of uninstalls happen on the same day or within the first 14 days, it could point to onboarding challenges rather than issues with your app itself.
The dashboard defaults to showing data from the last 30 days, but you can adjust the date range to analyze trends over longer periods. For more detailed analysis, use the Export button to download CSV files of your merchant data, earnings, or full event history.
sbb-itb-ce93587
Tracking Install Sources with Google Analytics
Use Google Analytics 4 (GA4) to identify install sources for your app. While the built-in metrics show the number of installs, GA4 provides deeper insights into the reasons and channels driving those installs.
Connecting Google Analytics 4 to Your App Listing
First, retrieve your GA4 Measurement ID by navigating to Admin > Data Streams > [Your Stream]. Then, create an API Secret under Admin > Data Streams > [Your Stream] > Measurement Protocol API secrets > Create.
Once you have these credentials, go to Partner Dashboard > Apps > [Your App] > Distribution > Manage Listing. In the "Tracking information" section, input your Measurement ID and API Secret. The Measurement ID tracks client-side events like button clicks, while the API Secret enables server-side tracking, such as completed installs. Server-side tracking is more reliable for understanding actual installs.
Using Events to Track Install Intent
Shopify automatically generates events tied to the install process, making it easier to track user behavior:
| Event Name | Type | What It Tracks |
|---|---|---|
Add App button |
Client-side | When a merchant clicks "Install" on your listing page |
shopify_app_install |
Server-side | Successful OAuth installation by a merchant |
shopify_app_ad_click |
Server-side | Visits to your listing from a Shopify App Store ad |
view_item |
Client-side | When a merchant views your app's details page |
The shopify_app_install event triggers after the OAuth process, ensuring accurate install tracking.
"To provide full details of the app installation funnel, the Shopify App Store uses Google Analytics 4's Measurement Protocol for server-side events (like app installation)." - Shopify Developers
Mark both the Add App button and shopify_app_install events as Key Events in GA4 (formerly known as Conversions). This makes them stand out in your Acquisition and Advertising reports, helping you evaluate which channels drive completed installs.
Keep in mind that server-side event parameters, such as those tied to shopify_app_install, may take up to 24 hours to appear in GA4 reports. Be cautious when analyzing same-day data.
Once events are set up, use GA4 Acquisition reports to link these events to specific install sources.
Reading Acquisition Reports in GA4
To analyze install channels, navigate to Reports > Acquisition > Traffic acquisition in GA4. Set the primary dimension to "Session source/medium" or "Session campaign" to identify where installs are coming from. For more details on how these metrics are calculated, see our keyword tracking FAQ.
For Shopify-specific insights - like whether a merchant found your app via organic search, a category page, or a Shopify App Store ad - you can register custom dimensions. In the GA4 Admin panel, add surface_type and surface_detail as Event-scoped Custom Dimensions.
surface_type: Shows the origin page (e.g.,search,category,search_ad,home).surface_detail: Provides more specifics, such as the search query or category name.
Register these custom dimensions as soon as possible to make this data available in your reports. This added context will help you better understand how merchants discover and install your app.
Monitoring Install Trends in Shopify Partners
Once you've activated GA4 integration, it's crucial to regularly check your Partner Dashboard to make sense of your app's install metrics.
Building a Regular Review Routine
Start with the Partner Dashboard's Overview page, which defaults to a 30-day view and highlights four key metrics: Merchants with your app (active stores), Merchant growth, Installs, and Uninstalls. The percentage change compares your chosen date range with all data from your app's launch up to the start of that range.
Make it a habit to review the Overview weekly and dive deeper monthly by visiting Insights > App history. Here, you'll find a detailed log of install and uninstall events. Pay special attention to the "Time to uninstall" breakdown, which categorizes churn into four timeframes: same day, 1–14 days, 15–90 days, and 91+ days. If you notice spikes in same-day or 1–14 day uninstalls, it often points to onboarding challenges rather than issues with your app listing. Export the "History" or "Current Merchants" data as a CSV file to cross-check install dates with external factors like listing updates, pricing changes, or marketing campaigns.
Breaking Down Trends by Device, Location, and Time
The Partner Dashboard lacks built-in segmentation by device or location, but GA4 can fill that gap. By setting surface_type, surface_detail, and locale as Event-scoped Custom Dimensions in GA4 (discussed earlier), you can analyze install data in greater depth.
The locale parameter is particularly helpful for identifying geographic trends. For instance, if you notice a rise in installs from fr or ja locales, it might be time to consider translating your app listing. A great example is Ship&co, a shipping app founded by Thomas Bertrand. After adding French and Japanese translations to their listing during the week of June 24, 2019, they experienced a significant boost in merchant growth.
"Being able to publish our app in these three languages on the Shopify App Store really helped us to get new customers in different countries." - Thomas Bertrand, Founder and CEO, Ship&co
Use GA4's date picker alongside your Partner Dashboard to uncover time-based patterns. If you see a dip in installs during a specific week, check the surface_inter_position or surface_intra_position parameters. A drop in search ranking often shows up in the data before you can spot it manually.
Combining these insights with Partner Dashboard data gives you a more comprehensive understanding of install trends.
Using Shopify Partners and GA4 Data Together
GA4's segmented insights, when paired with the Partner Dashboard, provide a complete picture. While the Partner Dashboard tracks installs and growth, GA4 helps you understand the "why" by revealing traffic sources, search terms, and user behavior.
"With the addition of the app and theme install events, you can now easily and confidently compare the performance of your various marketing efforts, like Shopify App Store advertising ads, both on and off Shopify." - John Hogan, Shopify
For example, if the Partner Dashboard shows an install spike, head to GA4's Traffic acquisition report and filter by surface_type to pinpoint the source. If the spike is linked to a search_ad surface type, it's clear your ad spend is paying off. If it's from organic search, check surface_detail for the keyword driving the traffic - this might signal the need to highlight that keyword in your app listing.
Keep in mind that Partner Dashboard data may have a delay of up to 10 minutes, while GA4 parameters can take up to 24 hours to propagate. Avoid jumping to conclusions based on same-day data if numbers look unusual. This dual approach ensures that every spike or dip in installs helps refine your strategy.
Going Further with AppJubilee
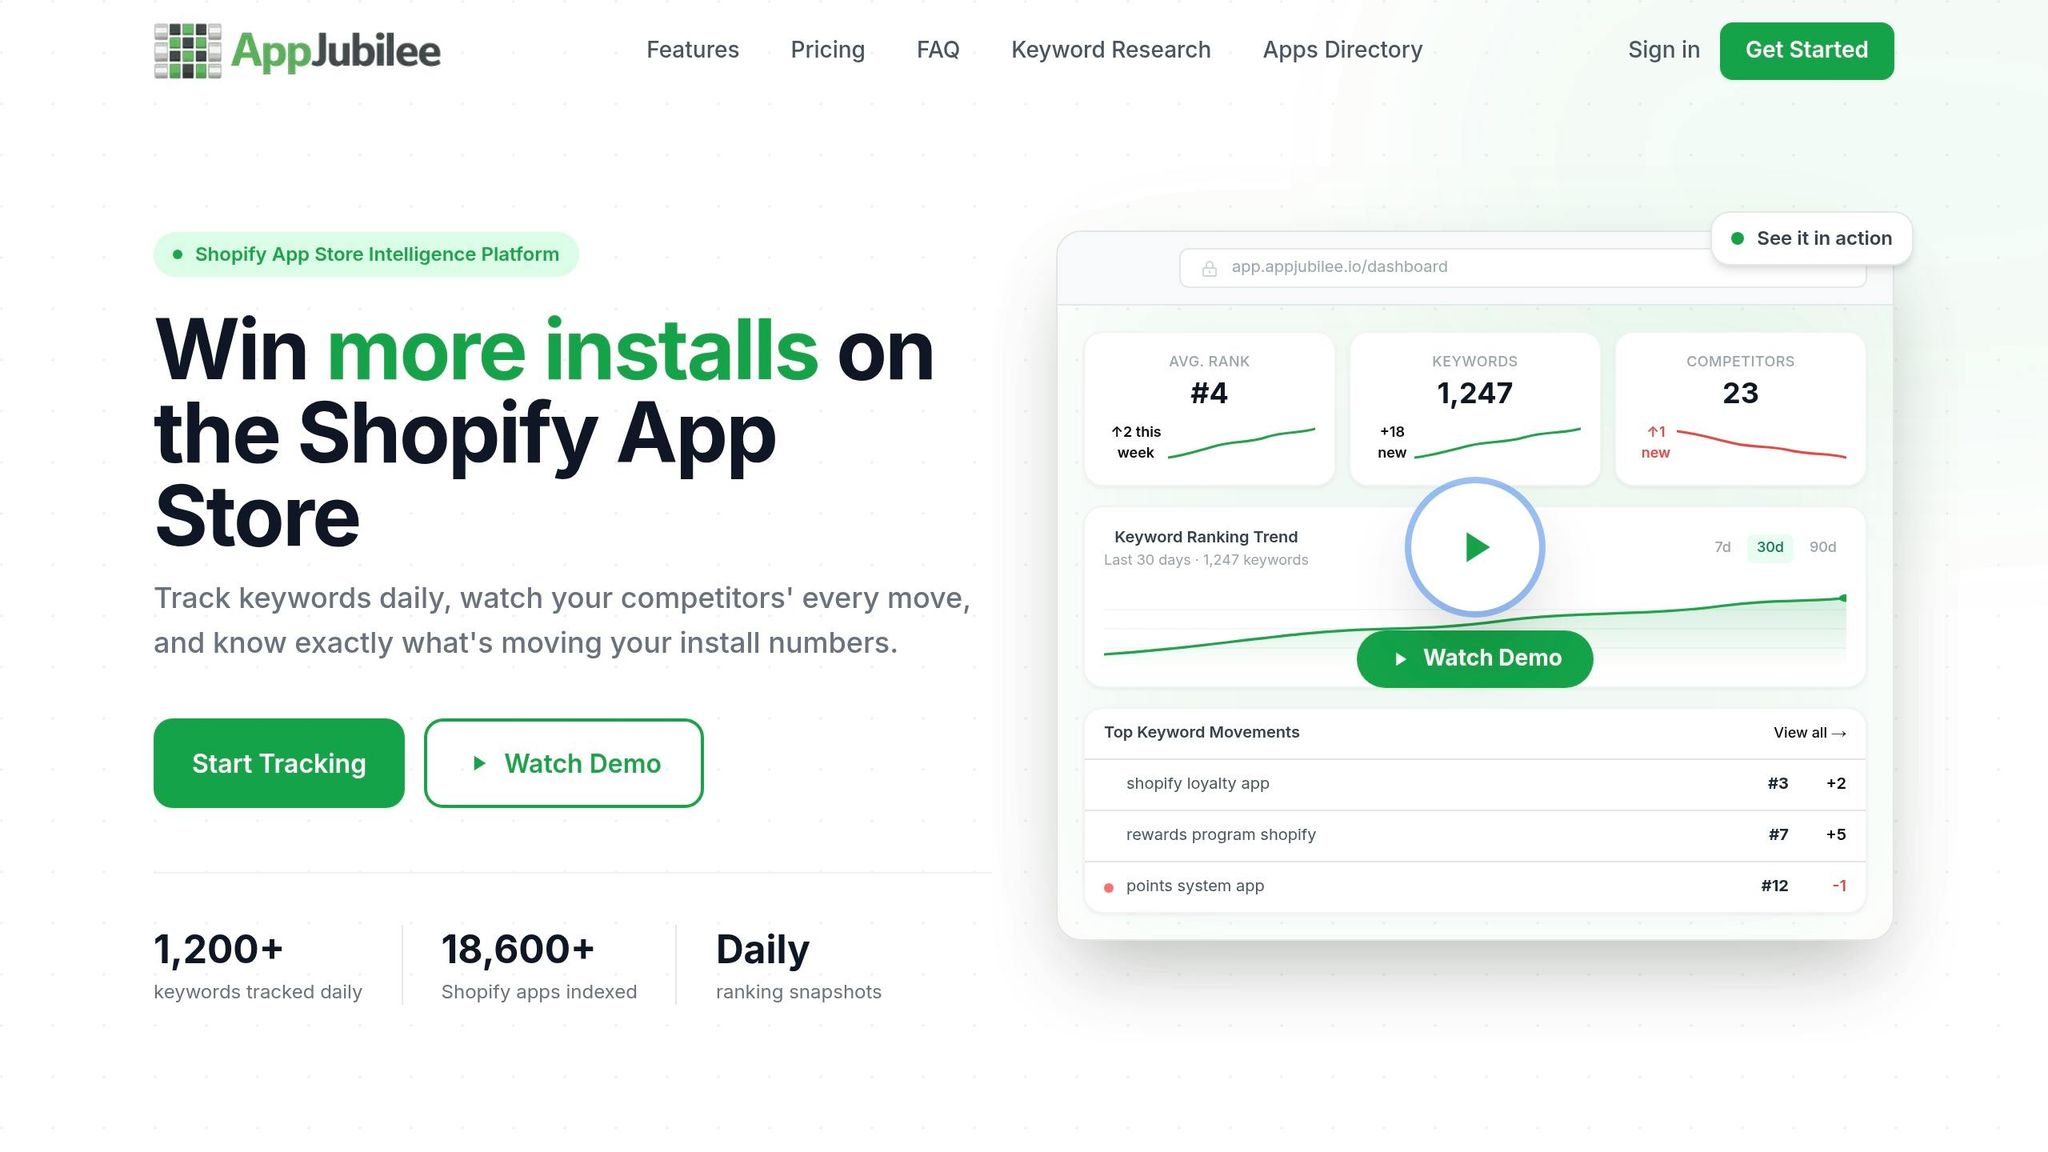
Shopify Partners and GA4 provide raw data, but AppJubilee takes it a step further by automating the process of linking install spikes, keyword trends, and listing updates.
How AppJubilee Connects to Shopify Partners and GA4
AppJubilee integrates directly with your Shopify Partner account and GA4 using OAuth. This setup pulls install source data - like shop IDs and referrer details - into one consolidated view. Instead of comparing Shopify app optimization tools and juggling multiple dashboards, you can easily track where installs come from, which keywords are driving them, and how your app ranks in the Shopify App Store.
One of its standout features is filtering out passive impressions to focus solely on clicks on the "Install" button. This approach highlights the keywords and listing elements that are actually driving conversions.
"Install clicks represent real purchase intent and are the most important metric for measuring keyword effectiveness." - Rankbase Documentation
Building on this integration, AppJubilee simplifies tracking even further by linking install events directly to listing updates.
Linking Install Trends to Listing Changes
AppJubilee automatically logs every update to your app listing - whether it's a tweak to the title, description, pricing, or screenshots - along with timestamps. This makes it easy to compare listing edits with changes in keyword rankings and install numbers.
The platform tracks daily keyword rankings for up to 365 days. With this historical data, you can assess whether a description update boosted your app's performance or had the opposite effect. Additionally, the Potential Score feature identifies keywords where your app is already getting install clicks despite ranking lower than expected. These keywords represent high-priority opportunities for optimizing your listing.
Real developers have achieved impressive results using these insights. Edgar Ibrahimov, the developer behind Migrationpro, used AppJubilee's keyword analytics to push his app's ranking from 13th to 1st for the term "duplicate store". Likewise, Özkan Öz of Craftshift updated his app listing based on the platform's data and claimed the #1 spot for his target keyword - securing a paid customer within just 30 minutes of making the change.
Prioritizing U.S. Merchant Insights
For U.S.-based developers, AppJubilee offers a significant edge with its locale-aware tracking. The dashboard defaults to the primary locale for your app's traffic, so if most installs come from U.S. merchants, your keyword rankings will automatically reflect English (US) search results.
This is especially important because Shopify App Store rankings can vary by region. By focusing on the English (US) market and cross-referencing install click data from GA4, you can make informed decisions tailored to what U.S. merchants are searching for.
AppJubilee's Growth plan starts at $99/month for up to 3 apps, including integration with GA4 and Shopify Partners. A 14-day free trial is available to help you explore the platform's features.
Conclusion: A Clearer Path to Tracking App Installs
Tracking app installs goes beyond simply tallying numbers - it’s about understanding the full journey merchants take. The Shopify Partner Dashboard offers vital native metrics, while GA4 provides deeper insight into which channels and search terms lead to installs. As Shopify's John Hogan aptly stated:
"Understanding what marketing channels and campaigns are most effective in driving business growth is critical to developer success."
This level of detail lays the groundwork for tools that bring all these insights together, enabling smarter, data-driven decisions.
FAQs
Why don’t Shopify installs match GA4 installs?
Shopify and GA4 often show different install counts because they use distinct tracking methods and timelines. Shopify gathers install data through its Partner Dashboard, API, or webhooks, focusing on post-merchant approval. On the other hand, GA4 uses event-based tracking, which depends on user interactions and may not immediately register all installs. Privacy settings and configuration differences further add to these inconsistencies, as each platform processes and records data differently.
Which GA4 events should I mark as key events?
To monitor app installs and related user actions effectively, here are some essential GA4 events to set up:
shopify_app_install: Captures when a merchant installs your app.shopify_app_ad_click: Tracks visits to your app listing that originate from ad clicks.Add App button: Logs clicks on the install button.onboarding_completed: Marks the completion of the onboarding process.- Other billable activities: Depending on your app's goals, you might track actions like
order_processedoremail_sent.
These events help you understand installation funnels and user behavior, offering valuable insights into how users interact with your app.
How can I see which Shopify App Store search terms drove installs?
To figure out which search terms are driving app installs, you can rely on tools like Google Analytics or Facebook Pixel. Shopify automatically adds URL parameters, such as surface_type and surface_detail, when merchants visit your app listing. By analyzing these parameters, you can gain insights into how users are discovering your app.
Additionally, search term reports from your ad campaigns can show you the exact keywords merchants are using in paid ads. By combining this data with the insights from URL parameters, you’ll get a clearer picture of the search terms and sources that are most effective for driving installs.