Ultimate Guide to Competitor Review Benchmarking
Benchmark Shopify app reviews: track ratings, velocity, sentiment, workarounds and reply speed to prioritize product, support and ASO.

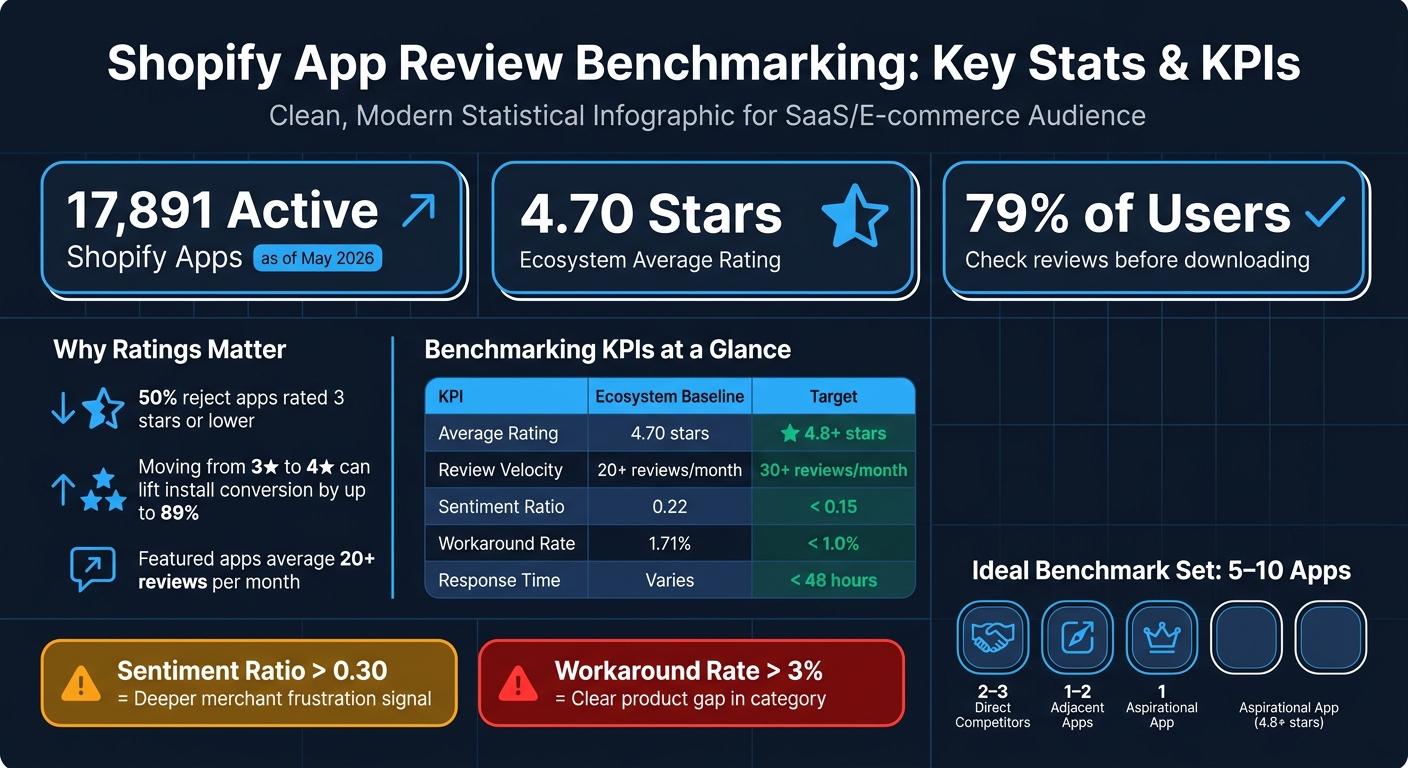
If you want more Shopify app installs, start with reviews. With 17,891 active Shopify apps and an average rating of 4.70 stars as of May 2026, I’d benchmark competitors on rating, review volume, recent review pace, sentiment, repeat complaints, and reply speed before changing product, support, or listing copy.
Here’s the short version of the article:
- I compare Shopify app optimization tools across 5 to 10 apps: direct rivals, nearby alternatives, and one top app with 4.8+ stars
- I use the same time window for all apps, usually the last 90 or 180 days
- I track the numbers first: average rating, monthly review pace, rating mix, negative-to-positive sentiment ratio, and reply time
- I read review text to spot repeat issues around features, bugs, UX, pricing, and support
- I pay close attention to workarounds, because they point to missing features merchants want now
- I review how competitors answer bad reviews, since slow or weak replies create room for me to stand out
- I turn those findings into a short action list for product fixes, onboarding, support macros, and App Store copy
- I repeat the process every month and connect review shifts to listing updates and ranking movement
A few numbers stand out:
- 79% of users check reviews before downloading
- 50% reject apps rated 3 stars or lower
- Moving from 3 stars to 4 stars can lift install conversion by up to 89%
- Featured apps often average 20+ reviews per month
- A sentiment ratio above 0.30 can point to deeper merchant frustration
- A workaround rate above 3% can mean a clear product gap in the category
In other words: I’m not just asking, “Who has more reviews?” I’m asking, “What are merchants upset about, how often does it come up, and can I fix or message that better than competitors?”
That’s the core idea behind competitor review benchmarking - and that’s what this guide walks through.
Shopify App Review Benchmarking: Key Stats & KPIs
Build Your Benchmark Set and Dataset
Select Competitors by Category, Keywords, Features, and Merchant Segment
Use the metrics above to build a benchmark set that reflects current market pressure, not just raw app popularity.
A good benchmark set usually includes 5 to 10 apps:
- 2 to 3 direct competitors
- 1 to 2 adjacent apps
- 1 aspirational benchmark with 4.8+ stars that shows what top-tier performance looks like in your category
That mix gives you a better read on the field. Direct rivals show where you're head-to-head. Adjacent apps show where buyers may drift. And the aspirational app sets the bar for what strong execution looks like.
Watch for market concentration too. If one app controls more than 25% of install share and also holds a 4.5+ rating, that market is concentrated. On the other hand, if the leader sits below 4.0, there's probably an opening.
It also pays to check free-tier saturation. If more than 50% of top apps in your category offer a free tier, a paid-only app starts at a structural disadvantage, no matter how good its feature set is.
Collect Review Data and Normalize Time Windows
For each app, collect the core review data: star rating, review text, publish date, reviewer/store name, reviewer country, developer response, and "used app for" duration. That last field helps you split day-one reactions from feedback based on long-term use.
Then compare reviews from the last 90 or 180 days against lifetime totals. That's how you spot who's winning now, not just who built momentum a year ago.
| Data Field | Why It Matters |
|---|---|
| Star Rating | Quantitative product review sentiment baseline |
| Review Text | Theme and pain point extraction |
| Publish Date | Enables 90/180-day normalization |
| Developer Response | Evaluates competitor support quality |
| Reviewer Country | Surfaces geographic market gaps |
| "Used App For" | Segments feedback by experience level |
Once your dataset is normalized, track changes over time. Otherwise, a short burst of reviews can throw off the whole benchmark and make a weak trend look stronger than it is.
Use AppJubilee to Track Competitors and Review Changes Over Time
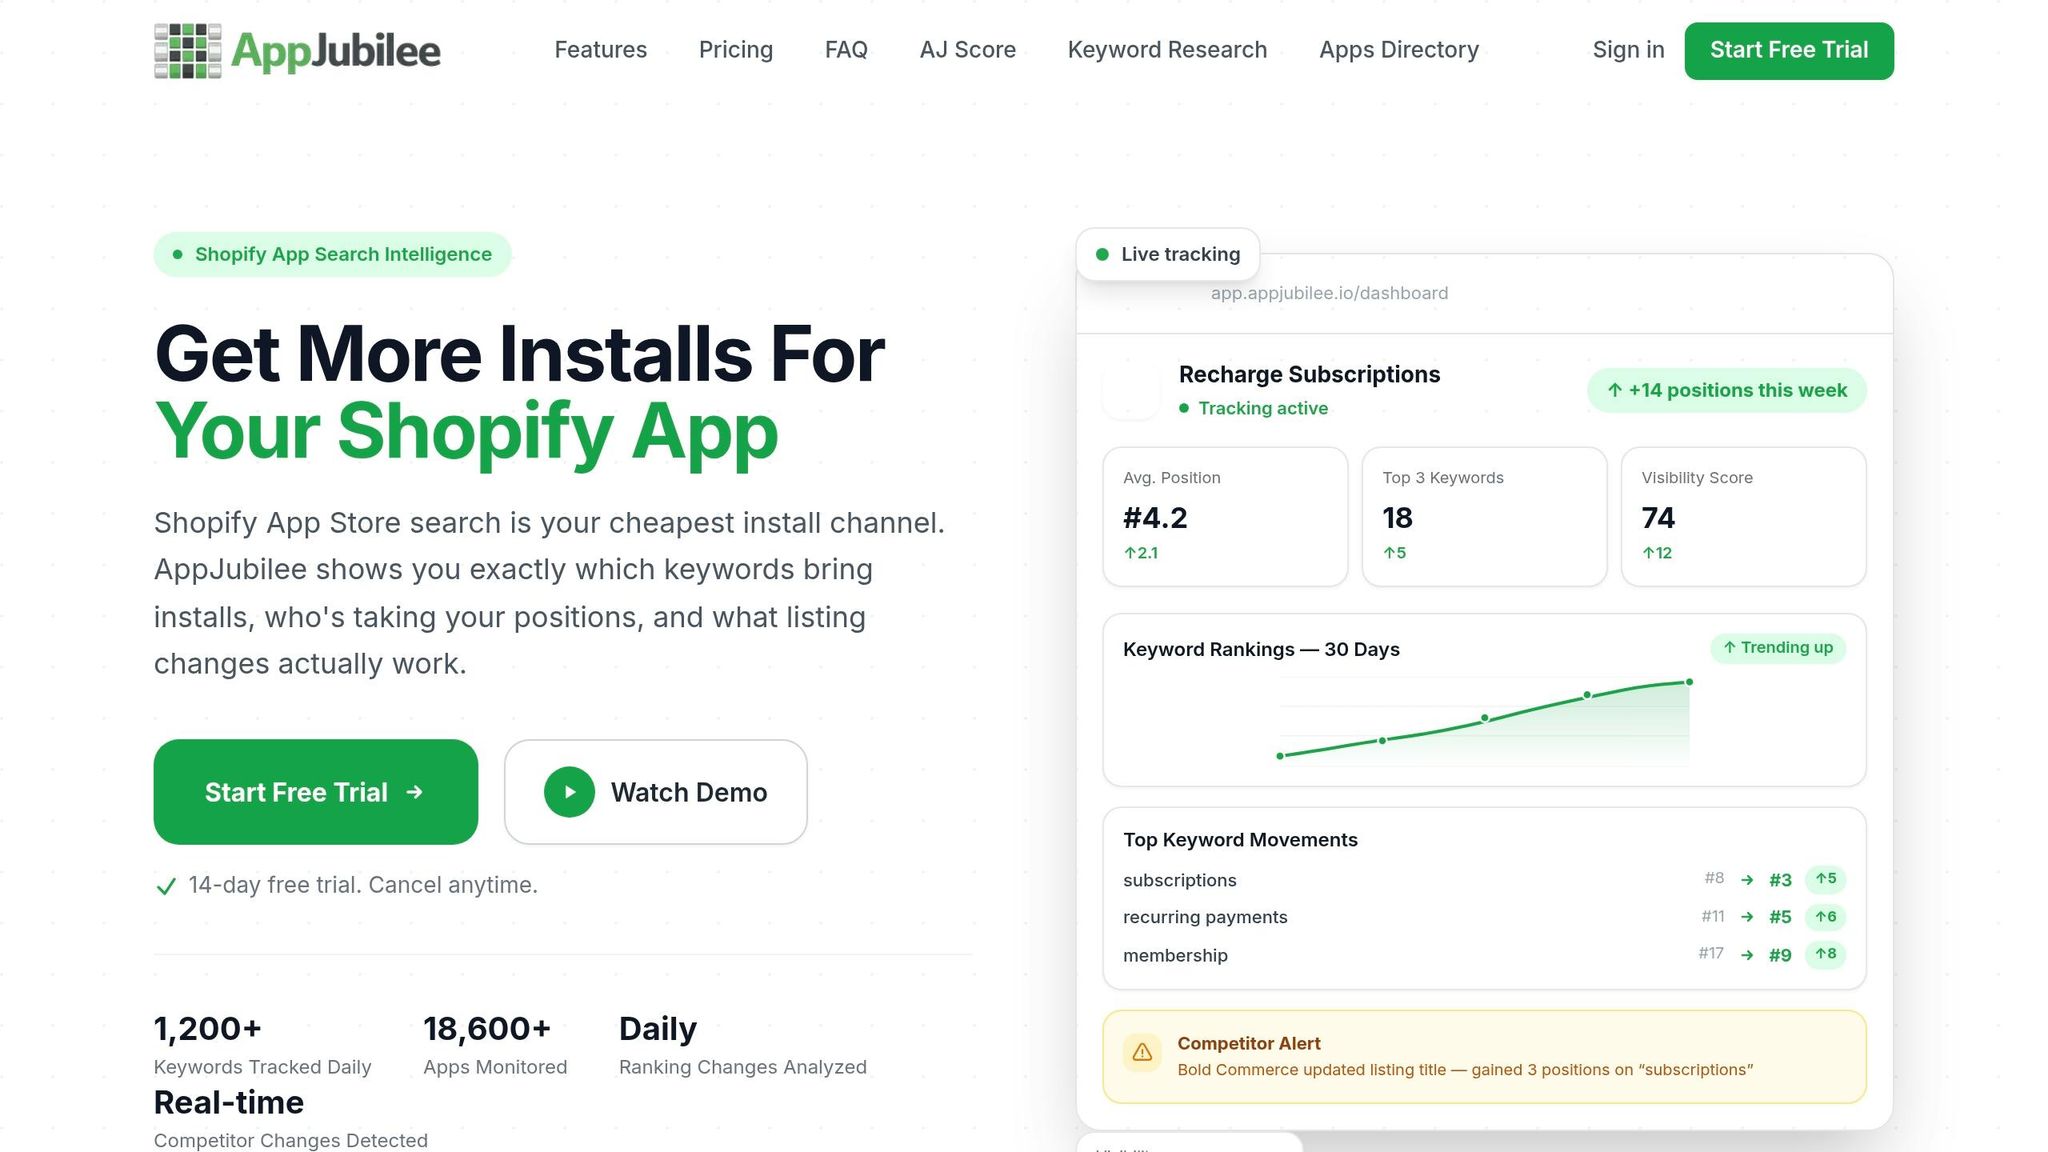
Catch spikes within 24 hours. AppJubilee handles ongoing tracking automatically. When you add an app, it instantly fills in 90+ days of pre-existing ranking and review history, so you're not starting from zero.
Its competitor mapping shows which apps rank for the same keywords, which helps keep your benchmark set current as the market shifts.
The Competitor App Watch feature sends alerts when a rival's review velocity jumps or their rating trend shifts. That makes it easier to connect review changes with keyword ranking movement.
With live alerts and historical snapshots, you can keep the benchmark set up to date as competitors gain or lose momentum.
sbb-itb-ce93587
Analyze Reviews by the Numbers and by Theme
Measure Ratings, Review Velocity, and Response Benchmarks
Start with the basics: ratings, review velocity, and reply behavior. These metrics help you compare competitors fast. Then dig into review text to see what’s driving the gap.
| KPI | Ecosystem Baseline | Target |
|---|---|---|
| Average Rating | 4.70 stars | 4.8+ stars |
| Review Velocity | 20+ reviews/month for featured apps | 30+ reviews/month |
| Negative-to-positive sentiment ratio | 0.22 | < 0.15 |
| Workaround Rate | 1.71% | < 1.0% |
| Response Time | Varies | < 48 hours |
Use these benchmarks to decide which competitors are worth a closer look. If an app has strong ratings, fast review growth, and active replies, it deserves a deeper read.
Numbers show who is winning. Themes show why.
Group Reviews by Theme and Sentiment to Find Repeated Merchant Pain Points
Next, sort review text into themes you can act on: features, bugs, UX, pricing, and support. Then count how often each theme shows up across your benchmark set.
One signal matters more than most: the workaround.
A workaround says more than a plain complaint. It shows that a merchant had to invent a process to get around a missing feature. That’s not just friction. That’s a product gap sitting in plain sight.
A workaround rate above 3% in a category means merchants are actively hacking around missing features - a strong signal for your product roadmap. The ecosystem average is 1.71%, so anything well above that deserves attention.
| Theme | What to Look For | Keywords to Count |
|---|---|---|
| Features | Missing functionality, feature requests | "wish", "need", "missing", "feature" |
| Bugs | Crashes, errors, broken flows | "crash", "bug", "error", "broken" |
| UX | Navigation, setup complexity | "confusing", "easy", "hard to", "interface" |
| Pricing | Value perception, plan limits | "expensive", "worth", "price", "cost" |
| Support | Response quality, resolution speed | "support", "help", "response", "refund" |
For example, if words like "crash", "expensive", and "confusing" keep showing up, you can measure which themes hurt competitors most. That turns scattered comments into something you can compare.
Once those repeated themes come into focus, check how each competitor answers the same complaints.
Evaluate How Competitors Reply to Negative Reviews
A developer’s reply to a 1-star review says a lot about how they treat merchants. It also gives you a direct opening to stand out. Focus on four things: response rate, response time, tone, and consistency.
If a competitor ignores negative reviews or uses fake reviews, or posts the same canned reply again and again, that’s a gap you can use in your own listing copy. Replying to a negative review also triggers an email notification to the merchant. Public replies can recover trust and signal support quality.
| Response Pattern | What It Signals | Your Opportunity |
|---|---|---|
| No reply to 1-star reviews | Low support investment | Highlight your response speed in listing |
| Generic, copy-paste replies | Generic and impersonal | Show personalized, specific replies |
| Replies within 24–48 hours | Strong support culture | Match or beat this benchmark |
| Replies that resolve the issue publicly | High merchant trust | Use as a model for your own response templates |
What you’re looking for is simple: repeated support gaps. When you spot them, you can turn them into a clear edge in both your product messaging and your review response process.
Turn Benchmark Findings into Product, Support, and ASO Actions
Rank Gaps by Impact, Frequency, and Effort
Once you've tagged themes and reply patterns, turn that input into a ranked action list. The goal is simple: convert review patterns into clear product, support, and ASO priorities.
Start with issues that damage trust. Payment failures, data loss, and broken syncs hit hard. The same goes for reviews that sound like churn warnings, such as "If they don't fix this, I'm leaving."
Frequency helps you separate one-off complaints from patterns that keep showing up. Count how often each theme appears, and treat it as a roadmap item only when it appears at least three times across a sample of 30 recent reviews.
Not every gap deserves your time. The best opportunities usually sit in areas tied to architecture or pricing that rivals can't fix fast.
That ranking should guide what you put in your listing, what you explain during onboarding, and what your support team prepares for.
Apply Review Language to Listing Copy, Onboarding, and Support
Use the same language merchants use in reviews across your listing, onboarding, and support. When people describe pain points in plain terms, that's often the best copy you'll get. It helps you speak to known problems and show where your app stands apart.
For example, if competitor reviews keep mentioning a "confusing interface" or "too many steps", your listing can counter that with phrasing like "intuitive UI." If merchants keep describing manual workarounds for a missing feature, that workaround should move near the top of your onboarding and messaging priorities. Better yet, automate it.
Support macros follow the same logic. If a competitor keeps dropping the ball on slow replies or weak fixes, build a macro for that exact case. If merchants are leaving because "Support told me this isn't possible", your team should already have a direct answer, plus migration docs that remove friction.
Once that message is in place, keep checking whether the market moves.
Re-Benchmark Monthly and Connect Reviews to Listing and Ranking Changes
The Shopify App Store tends to reward apps that stay active. Listings updated every 30 to 60 days often rank better, and review velocity matters more for rankings than total review count.
A monthly loop keeps this practical:
- Collect new reviews
- Tag themes
- Compare shifts
- Act on the top gaps
The part many teams miss is the connection between reviews, listing updates, and ranking movement. Track those together, not in separate buckets. Use AppJubilee to keep that monthly loop current.
Conclusion: Make Review Benchmarking a Repeatable Growth Process
Treat benchmarking like a monthly routine. Pull recent competitor reviews, tag the main themes, compare them with your app, and ship one fix. That's the goal for each cycle: one clear change.
Pay close attention to the signals that move first: velocity, sentiment, replies, and listing updates. Those signals matter only if they change what you build, what you write, or how you support users.
Competitor reviews tell you what merchants care about, what annoys them, and where your app needs to do a better job. The part that makes benchmarking worth doing is simple: act on what you find. Look for clear openings - specific gaps where competitors keep missing the mark - and turn those findings into product, support, and ASO updates. AppJubilee helps keep that process current with review intelligence, competitor monitoring, and ranking snapshots. Repeat that loop every month, and competitor reviews become a steady growth signal.
FAQs
How many apps should I benchmark?
Start with three to five direct competitors so the analysis stays focused and manageable.
Yes, some categories include thousands of apps. But most of them are just background noise. What matters most is the top 60 to 80 incumbents that hold the bulk of market share and reviews.
That’s where AppJubilee helps. It can map the most relevant competitors based on keyword overlap, so you’re not wasting time on apps that barely matter.
What review metrics matter most?
Focus on review velocity first. Apps that keep picking up new reviews often show stronger current momentum than apps that just have a big lifetime total.
It also helps to track the pain-to-praise ratio, workaround density, and sentiment trends. If the category norm is 0.22, anything above 0.30 can point to unmet merchant demand. And when feedback with workarounds climbs above 3%, that can signal high-value opportunities.
How often should I re-benchmark?
For Shopify app developers, competitor review benchmarking should be a continuous, automated process - not a one-and-done quarterly task.
Daily or weekly monitoring helps you spot changes in competitor sentiment and review velocity while they’re still happening. AppJubilee supports this with nightly data refreshes and 18 months of historical data for trend tracking.