A/B Testing for Shopify App Listings
Test one change at a time on Shopify app listings and judge by installs, retention, and revenue—not guesses.
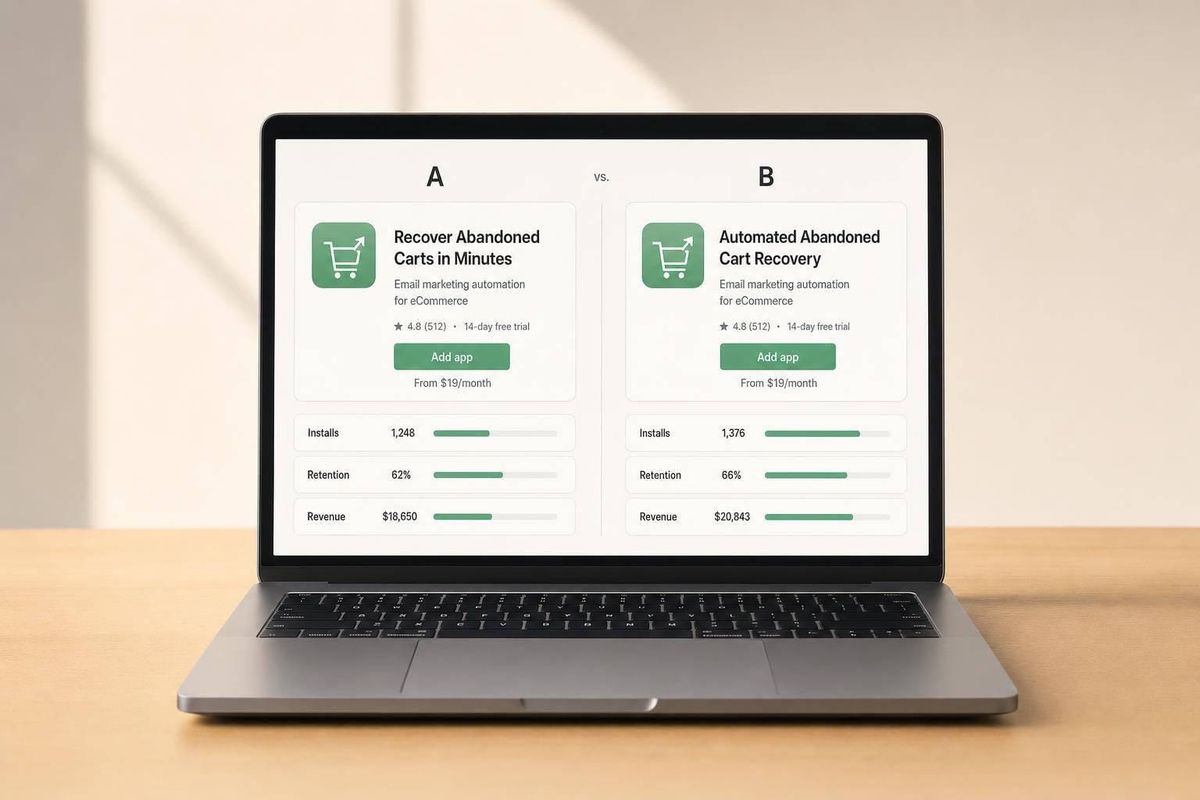
If I want more installs from a Shopify app listing, I need to test one change at a time and judge it by installs, retention, and revenue - not by guesses.
Here’s the short version:
- Shopify app listing tests run in sequence, not side by side
- I should test one listing element at a time
- The main number to watch is view-to-install rate
- I also need to check CTR, activation, 30/60/90-day retention, uninstall rate, and revenue per install
- A typical Shopify App Store view-to-install rate is 5% to 10%
- Strong listing changes can improve conversion by 20% to 40%
- A small test often needs 1,500 to 3,000 installs per version
- Test windows should usually run for 7, 14, or 28 days
In plain English: I make one edit, let it run long enough, compare it to the old version using Shopify app optimization tools, and keep the change only if the numbers support it.
What I’d test first:
- App title
- Subtitle
- Icon
- First screenshot
- First 200 characters of copy
- Pricing display
- “Free plan available” badge impact
What I’d decide before starting:
- My baseline conversion rate
- The one thing I’m changing
- The lift I want to see
- The point where I keep, revert, or mark the test as unclear
A simple rule works well: if a new version gets more installs but brings worse retention or more uninstalls, it may not be the right move.
| Area | What I’m checking | Why it matters |
|---|---|---|
| Search | CTR | Shows if more people click the listing |
| Listing | View-to-install rate | Shows if the page gets installs |
| Product fit | Activation and retention | Shows if the right merchants install |
| Revenue | Revenue per install | Shows which version brings more money |
| Risk | Uninstall rate | Shows if the listing sets the wrong expectation |
So this article is about one thing: how I can run Shopify listing tests with a clear setup, clean comparison, and a simple system I can use again.
How A/B Testing Works for Shopify App Listings
A/B testing a Shopify app listing means comparing one unchanged version with one changed version to see which one performs better. In plain English, you make one edit, watch the numbers, and let the results guide the call.
That matters because listing updates can feel a bit like guesswork without a test. A/B testing gives you a way to turn those edits into measurable decisions. The next move is simple: use Shopify app keyword research to pick a single change that has a shot at moving your main metric.
Key Terms and Metrics to Define Before You Start
Before you touch your listing, lock in your definitions. For most Shopify app listing tests, the primary metric is install conversion rate: the percentage of listing views that turn into an install. Then you use secondary metrics to fill out the rest of the picture, including activation rate, retention rate, uninstall rate, and revenue per install.
| Metric Type | Metric | What It Measures |
|---|---|---|
| Primary | Install Conversion Rate | Percentage of listing views that result in an install |
| Secondary | Tap-Through Rate (CTR) | Share of users in search results who click into the product page |
| Secondary | Activation Rate | Percentage of installs that complete a key setup milestone |
| Secondary | Retention Rate | Percentage of installs active after 30, 60, or 90 days |
| Secondary | Uninstall Rate | How often users uninstall the app; high rates can suppress search rankings |
| Secondary | Revenue Per Install | Total revenue generated divided by the number of installs |
Set these metrics first so you don't end up bending the story after the test is over. That's where teams get into trouble. A variant might lift installs, but if it also drives more uninstalls, you may still come out behind.
Think of these metrics as your scorecard. Every test that comes next depends on them.
With the metric set, the next thing to check is traffic. Can your listing support a valid test, or are you working with too little data?
Why App Listing Tests Run in Sequence, Not Side by Side
Shopify app listing tests have to run in sequence because the store does not support parallel variants. So the process is straightforward: run Version A, update the listing, then run Version B.
The catch is time. Since these versions run in different periods, outside factors can distort the comparison. A seasonal bump in merchant activity during one test window, for example, can shift results even if your listing change had little to do with it.
Traffic mix can also throw things off. Brand-name searches often have install rates more than 10% higher than non-brand searches. If one version gets more brand traffic than the other, you can end up with a false winner.
When Running a Test Is Worth the Effort
Not every listing should be tested right away. Detecting a 5% lift in conversion usually takes 1,500 to 3,000 installs per variant. That's a decent volume, and plenty of apps just won't hit it fast enough.
Timing matters too. Run tests across full weekly cycles, such as 7, 14, or 28 days, so day-of-week swings in merchant behavior don't muddy the data . If you can't reach the sample size, it's better to wait than to force a test and trust shaky results.
Once you know the test is worth the effort, the next step is picking the listing element most likely to move your primary metric.
sbb-itb-ce93587
Choose What to Test in Your Shopify App Listing
Start With the Elements That Shape First Impressions
Shopify listing tests happen one after another, so your first move matters. Start with the part of the listing most likely to change conversion.
Most Shopify app installs begin in search results. That’s why your app name, app card subtitle, first-screen copy, and screenshots should get the first look.
The "free plan available" badge can influence filter-based traffic and install intent. And small visual changes can have a big effect. One featured-image-only update lifted installs by 11.8% in two weeks and almost doubled paid subscriptions.
| Element | Why It Matters | Estimated Impact |
|---|---|---|
| First 2 Screenshots | Above the fold; shapes install intent before scrolling | 5–25% variation |
| App Icon | Most visible element in search results | 10–35% variation |
| First 200 Chars of Description | Conversion moment for merchants who don’t scroll | High |
| Pricing Presentation | Major filter merchants use; conversion lever | Standard |
Once you know which parts drive that first impression, turn each idea into something you can test.
Turn Listing Ideas Into Testable Hypotheses
A solid test idea needs four parts:
- the element you want to change
- the baseline metric
- the lift you expect
- the rule for what happens next
Use this format: [Element] + [Baseline metric] + [Expected lift] + [Decision rule].
For example: "Changing the first screenshot to benefit-led overlays may increase view-to-install conversion by at least 5% over a 7- to 14-day period. If it doesn't, revert."
This kind of setup keeps you honest. You set the bar before the test starts, which makes it much harder to talk yourself into calling a weak result a win later on. Benefit-led captions also tend to land better than feature-led copy.
Here’s how that structure works across common listing elements:
| Element | Hypothesis Example | Target Metric |
|---|---|---|
| App Title | Adding a primary keyword after the brand name will improve search visibility | +5–10% CTR |
| Icon | Switching to a high-contrast design will improve recognition in search grids | +3–5% CTR |
| Screenshots | Moving outcome-focused screenshots to position one will clarify value faster | +4–7% install rate |
| First-Screen Copy | Leading with a specific merchant pain point in the first 200 characters will increase view-to-install rate | +5–15% install rate |
After you choose the strongest hypothesis, lock in the baseline and test one change at a time.
Use AppJubilee to Prioritize What to Test First
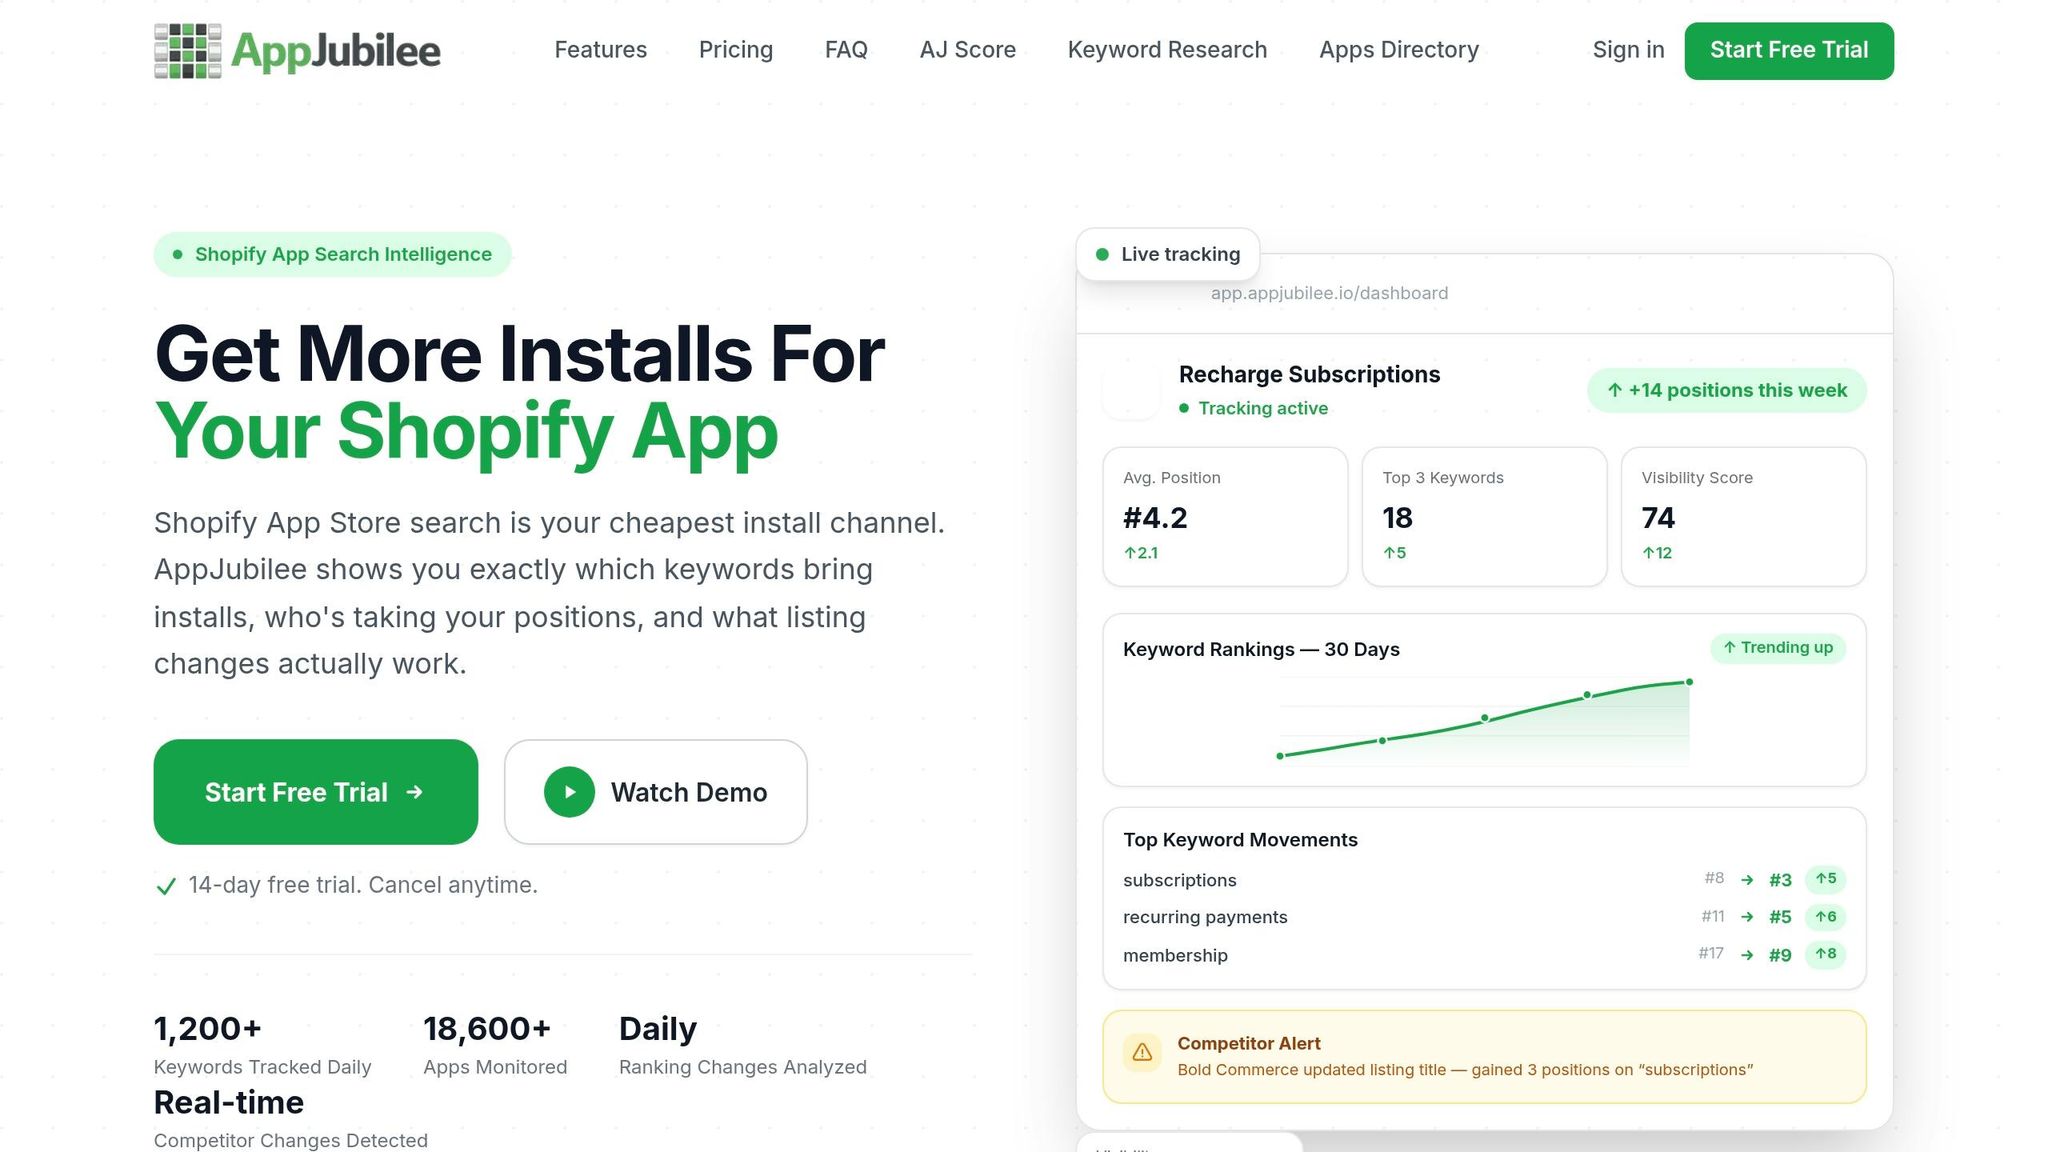
Use AppJubilee's listing change impact tracking and ranking snapshots to spot which edits came before shifts in ranking, CTR, or installs. Then test the highest-risk change first.
Once you’ve picked the top test, define the baseline, change one element, and set the success metric before you run it.
How to Set Up and Run a Listing A/B Test
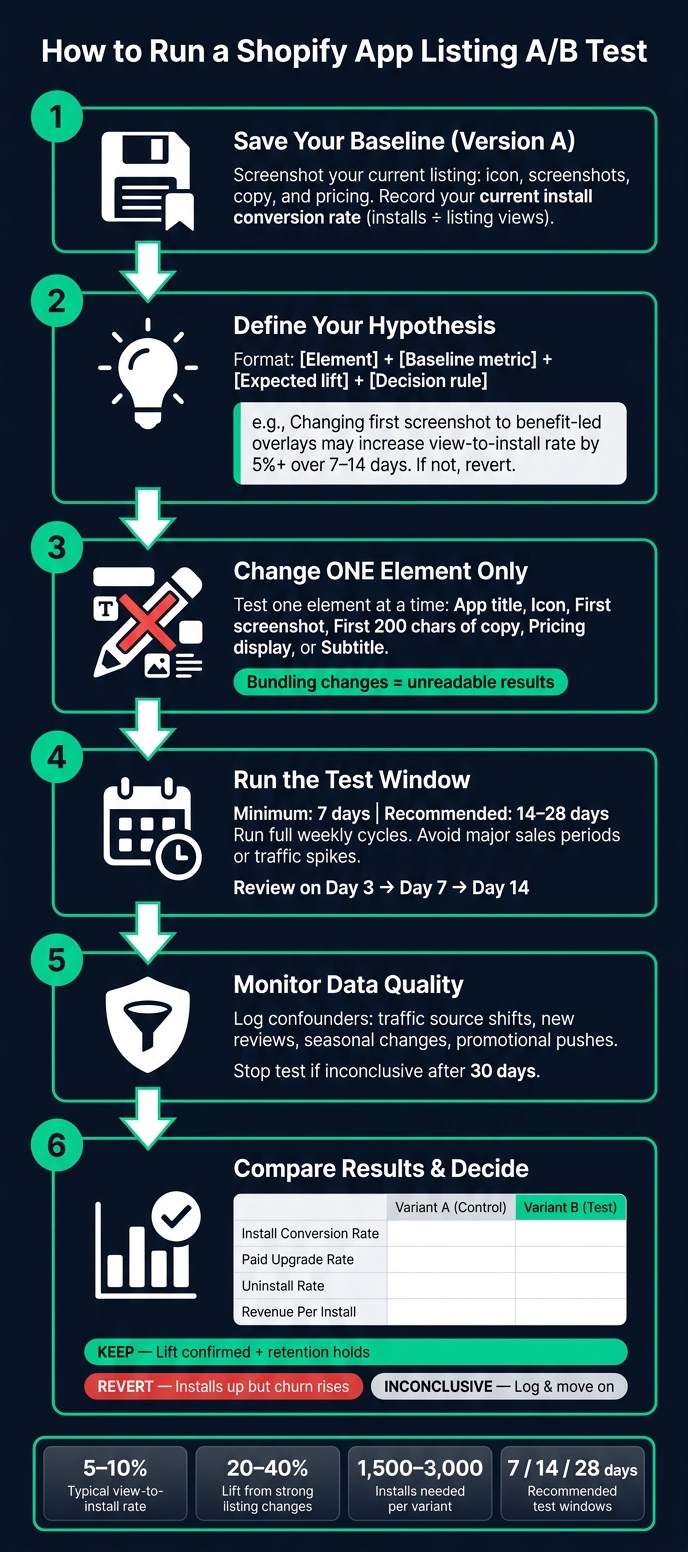
Shopify App Listing A/B Testing Process: Step-by-Step Framework
Define Your Hypothesis, Baseline, and Success Metric
Start by saving your current listing as Version A before you touch anything. That means the parts people notice first: your screenshots, copy, and icon.
Use install rate as your main success metric. That’s installs divided by listing views. But don’t stop there. Also track install-to-activation and day-7 retention so a lift in installs doesn’t hide weak-fit traffic.
After you’ve locked in the baseline and success metric, test ONLY the change you want to measure.
Change One Listing Element at a Time
Keep the test simple: change one element at a time. If you swap your icon, first screenshot, and subtitle all at once, you won’t know what caused the result. If you do need to bundle changes, treat them as one hypothesis before the test begins.
Run both versions for at least 7 days. If you want more confidence, use 14 to 28 days. Also, stay away from major sales periods and traffic spikes. Those can throw off the comparison.
Once your test window is set, keep an eye on anything that might skew the data.
Check Data Quality While the Test Runs
Try to keep conditions for Version A and Version B as close as possible. Log confounders as they happen, including:
- traffic source shifts
- product review trends
- seasonal changes
- promotional pushes that affect only one test period
If you use AppJubilee, its listing change impact tracking plus GA4 and Shopify Partners integrations can help you line up listing edits with metric movement. Check performance on day 3, day 7, and day 14 after a change goes live. That gives you a chance to spot early negative signals or indexing issues before they snowball.
If a test is still inconclusive after 30 days, stop it and record the result.
When the test window ends, compare the outcome against your original baseline.
Read Your Results, Pick a Winner, and Build a Repeatable Process
Compare Conversion, Upgrade Rate, and Revenue Per Install
When your test window ends, pull the numbers from both periods and compare them side by side. Look at install conversion rate, paid upgrade rate, and revenue per install to pick a winner - not raw install count by itself.
| Metric | Variant A (Control) | Variant B (Test) | Difference | Interpretation |
|---|---|---|---|---|
| Listing Views | - | - | - | Improved search visibility or CTR |
| Installs | - | - | - | Better alignment between intent and copy |
| Install Conversion Rate | - | - | - | Which variant is more persuasive |
| Paid Upgrade Rate | - | - | - | Higher quality users or stronger value prop |
| Uninstall Rate | - | - | - | Whether the listing is overselling features |
| Revenue Per Install | - | - | - | Which variant attracts higher-value merchants |
A lift in installs can look good at first glance. But if that same variant also drives more churn, it can be a net negative. High churn can hurt search visibility.
If your numbers don’t all tell the same story, go back to your main goal and use that to break the tie.
How to Decide When Results Are Mixed or Unclear
Mixed results happen all the time. One version may bring in more installs, while the uninstall rate also climbs. That usually means the new listing is pulling in the wrong merchants.
So don’t judge the test in a vacuum. Tie the decision to the business outcome that matters most - whether that’s paid MRR, long-term retention, or higher-quality installs.
Before you lock in a change, run the numbers through a statistical significance calculator to make sure the gap isn’t just random noise. If the test still isn’t significant after about a month, treat it as inconclusive. At that point, use some common sense: keep branding-led updates like screenshots if they help, but roll back functional changes like key benefits if they didn’t move the needle.
Build a Continuous Testing Process With AppJubilee
One test won’t change your listing overnight. The gains come from running tests again and again, then learning from each one.
A simple way to stay organized is to keep a short backlog of listing hypotheses, ranked by likely impact and effort. Then test them one at a time.
For each test, record:
- the date range
- the exact element you changed
- your hypothesis
- the outcome: winner, loser, or inconclusive
That record turns into your team’s knowledge base. After a while, patterns start to show up. You’ll see which elements change revenue per install, which edits bring in the wrong traffic, and which copy angles click with paying merchants.
Log the result, then use what you learned to choose the next hypothesis. Use AppJubilee to track each test, compare before-and-after results, and plan the next move.
FAQs
What if my traffic is too low for a valid test?
If your app listing doesn't get enough traffic, A/B testing won't give you results you can trust. It only works when you reach statistical significance, and that takes a solid number of visitors.
So if you're launching a new app and trying to land your first hundred installs, put A/B testing on the back burner for now. Your better move is to tighten up your keyword metadata and strengthen the basics of your listing. That helps build visibility and organic traffic first, so later tests have enough volume to mean something.
How do I tell if a conversion lift is worth keeping?
Make sure the lift doesn't come at the cost of long-term user quality or retention. More installs are good, but Shopify puts more weight on apps that merchants keep.
If a listing change drives more installs but also pushes up uninstall rates, that can send a negative quality signal and hurt rankings. Use AppJubilee to track the impact of listing changes and make sure the lift holds up, instead of turning into a short-term spike in installs.
Which listing element should I test first?
Start with keyword research and metadata optimization.
Shopify looks at your app name, search terms, and description to decide if your app should show up for a search query. That makes these fields the highest-leverage places to dial in first.
Once that keyword base is set, move to your visuals and on-page copy to improve conversion rates.