
Market Share Gaps in Shopify App Categories
Track keyword coverage, review velocity, sponsored ads, and category footprint to spot Shopify app market-share gaps and prioritize fixes.

Most Shopify app categories are not close races. In many cases, a few apps take most of the installs, reviews, and search visibility. One social proof leader holds 81.9% share, and in email marketing, Klaviyo holds 57.6% share in a category used by 35.65% of Shopify stores.
If I want to spot a market share gap early, I would look at four visible signals first:
- Keyword gaps: competitors rank for terms I miss
- Review pace: leaders add reviews faster than I do
- Sponsored reach: competitors appear in ads where I do not
- Category footprint: leaders show up across more related use cases
The point is simple: market share problems usually show up before revenue drops. If my app is missing high-intent searches, adding fewer than 3 reviews per week, absent from sponsored placements, or limited to one narrow category, I am likely losing ground.
A simple way to act on this is:
- Fix core keyword coverage in the title, subtitle, and opening description
- Track weekly review growth and improve review request timing
- Check where competitors keep showing up in sponsored results
- Map nearby categories where my app fits but does not appear
Here is the short version of what matters most:
| Signal | What I would check | Warning sign |
|---|---|---|
| Keywords | Missing high-intent search terms | Competitors rank, I do not |
| Reviews | New reviews per week | Fewer than 3/week |
| Ads | Sponsored placements by keyword | Competitors appear for 3+ days |
| Categories | Related category presence | My app is absent from nearby use cases |
I would then score each gap by impact, effort, and confidence to decide what to fix first. In most cases, keyword gaps and review pace come first because they are easier to change and easier to track over 7-day and 30-day windows.
This article shows how I would use those four signals to measure where an app is behind category leaders and what to fix next.
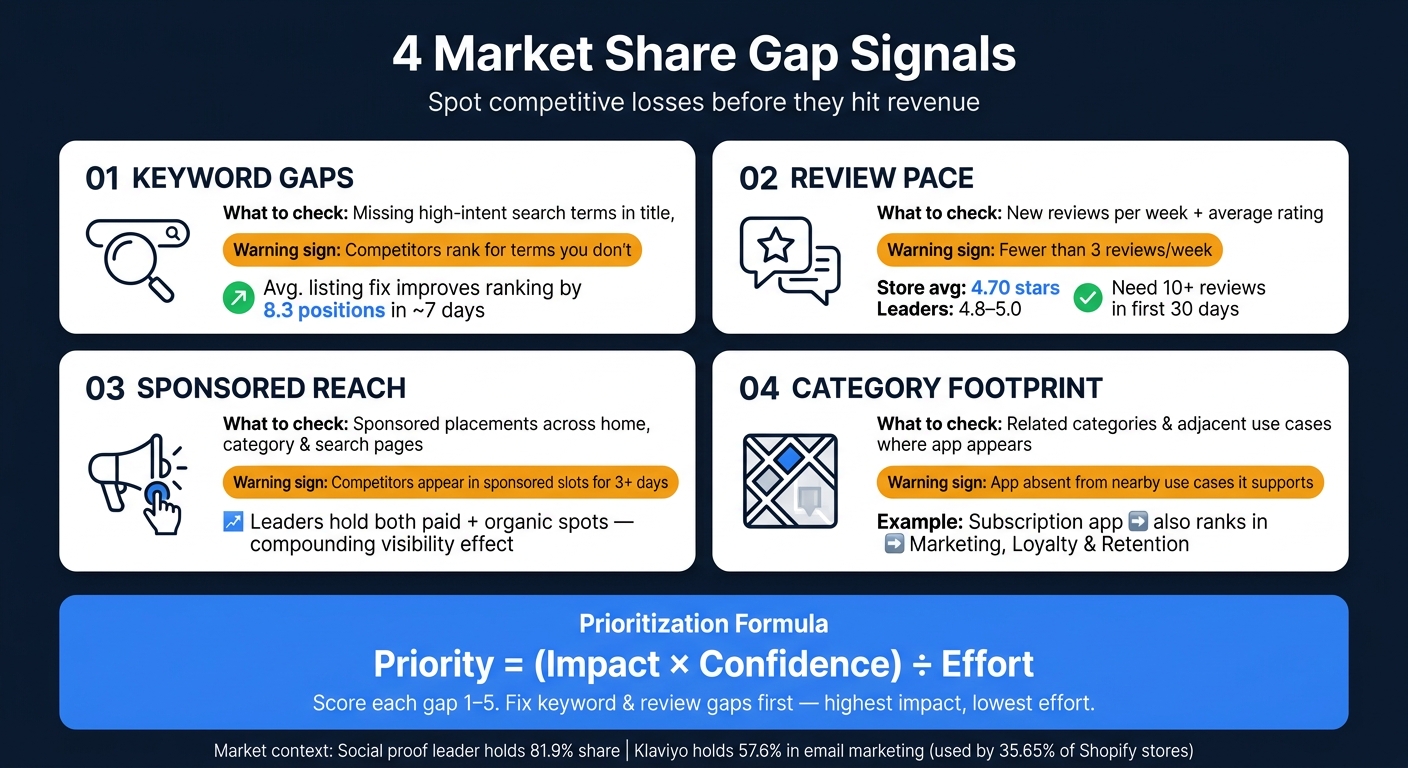
4 Market Share Gap Signals: What to Track & Warning Signs
Find keyword coverage gaps against category leaders
Apps miss installs when they don't show up for high-intent merchant searches like "abandoned cart recovery" or "subscription billing." If your app isn't in those results, that install usually goes to a competitor.
Audit leader keywords by use case and merchant language
Start with 3–5 apps that keep showing up near the top of your category. Then review each app's title, subtitle, and first 2–3 description paragraphs. Focus on terms that appear across several leaders, not random one-offs. Those repeated phrases usually line up with the language merchants type into search.
Review text can be even more useful because merchants explain their problems in plain English. You might see phrases like "set up subscription boxes without custom code" or "simple upsell popup at checkout." That kind of language tells you how buyers think.
Group these terms by use case so patterns are easier to spot:
- Discounting
- Automation
- Recovery
This makes gaps hard to miss. You can quickly see which merchant problems your listing speaks to and which ones it ignores. Then use those gaps to decide what to fix first.
Turn missing keywords into listing changes
Add missing terms to your title, subtitle, and the first 500 characters of your description, where search weight is highest. For example, if a subscription billing app ranks well for "recurring billing" but doesn't appear for "Shopify subscription app," a title update like "Subscriptions & Recurring Orders for Shopify" can help. Pair that with a subtitle such as "Create subscription plans, manage recurring billing, and reduce churn."
Don't redo everything at once. Make changes in measured steps so you can see what moved the needle. It usually takes around 7 days to see the ranking impact of a listing change, and optimized edits produce an average improvement of 8.3 positions. Track rankings daily so each edit can be tied to a position change.
Once keyword gaps are mapped, compare review pace to see whether visibility is turning into momentum.
sbb-itb-ce93587
Measure review pace gaps before they widen
After keyword coverage, the next thing to check is review pace. Total review count matters, but pace matters more. Fresh reviews show active demand, which means a newer app with momentum can outrank a bigger app that has gone quiet.
Compare total reviews, recency, and weekly review velocity
Look at your top 3–5 category competitors and track three numbers for each one:
- Total reviews
- Average rating
- New reviews added per week
A category leader sitting at 4.9 stars and adding 20+ reviews a month is showing steady momentum.
The store-wide average rating is 4.70 stars across 807,113 reviews, so dropping below 4.5 stars is a clear warning sign. New apps also tend to need at least 10 reviews in their first 30 days to get early traction.
| Metric | Category Leaders | Early Warning Signal |
|---|---|---|
| Average Rating | 4.8–5.0 | Drops below 4.5 |
| Weekly Review Velocity | 5+ new reviews/week | Fewer than 3 per week |
| Review Growth | Consistent, week over week | Stagnant for 30+ days |
Link review gaps to onboarding and request timing
If installs look healthy but reviews are lagging, check your onboarding flow. In many cases, the issue isn't demand. It's timing. Ask for reviews 7–14 days after install.
You can also use review intelligence to connect review spikes with ranking changes. That helps you see whether stronger review flow is moving the needle or just making noise.
If review velocity looks good but market share still trails, the next gap is sponsored visibility.
Check ad presence and category reach gaps
Once you know the keyword gaps and review gaps, look at visibility from another angle: are competitors paying to stay in front of buyers too? Ad presence and category reach help answer that. Put together, they show whether top apps are doing more than ranking in organic search. They may also be widening their reach through paid placements.
Find where leaders hold sponsored visibility
Shopify App Store ads can show up on home, category, subcategory, and search pages, and they run on a cost-per-click auction.
One pattern matters a lot here: a leading app shows up in both sponsored spots and top organic positions for the same query. That creates a compounding effect. Paid placement strengthens an already strong organic position, which makes it tougher for smaller players to get seen.
AppJubilee's Ads Intelligence can track which apps appear in sponsored positions across a set keyword list. It can also flag sustained ad presence, which here means appearing in sponsored results for 3+ days. When you pair that with keyword ranking data, you can see what a competitor is doing. Are they backing up an already strong organic spot, or are they using ads to make up for a weaker one?
Compare category footprint across adjacent use cases
Category footprint means the number of nearby categories and use cases where a top app appears. Leaders don't just win in one lane. They also show up across related searches and connected use cases that feed into that main category. For example, a subscription app may rank under "Subscriptions" and also appear in nearby categories like "Marketing & Conversion", "Loyalty & Rewards," and "Customer Retention." That lets it catch merchants who search by outcome, not just by feature.
To map this, check each top competitor across related categories and note where they appear, either organically or in sponsored slots. Then look closely at the problem-focused language in their titles and descriptions. Phrases like "reduce churn", "boost repeat purchases," or "increase AOV" show how they frame the app for different merchant intents. After that, compare those patterns with where your app already appears.
The gap tends to show up in two places:
- Categories where your app doesn't appear at all, even though it supports that use case
- Listings where your copy leans on a generic message instead of speaking to the exact problem a merchant in that category is trying to solve
Use that footprint map to rank the reach gaps that matter most.
Build a simple gap-closing plan
Turn those four signals into a ranked fix list. Start with keyword coverage, then move to reviews. After those gaps start to shrink, look at paid reach and category expansion.
Score gaps by impact, effort, and data confidence
Once you've mapped the gaps, rank them by impact and effort. Score each one on Impact (expected install lift), Effort (how much work it takes), and Data Confidence (how reliable the signal is) using a 1–5 scale. Then calculate priority with this formula: Priority = (Impact × Confidence) ÷ Effort.
That formula helps push the highest-payoff fixes to the top. In most cases, core keywords shared by most market leaders end up near the top of the list.
Use the score to decide what needs attention this week and what can wait until next month:
| Gap Type | Impact | Effort | Data Confidence |
|---|---|---|---|
| Core keyword gaps | High | Low (listing edit) | High (40%+ competitor consensus) |
| Page 2 rankings (positions 11–20) | High | Low (copy tweaks) | High (clear position delta) |
| Review velocity | High | Medium (onboarding flow) | Medium (7-day rank impact) |
| Ad presence | Medium | High (ad spend + creative) | High (observed sponsored slots) |
| Category reach expansion | Medium | High (repositioning + copy) | Medium (adjacent category data) |
Ad presence and category reach gaps usually come later in the plan. Not because they matter less, but because they tend to work better once your listing and review signals are in better shape.
Check 7-day and 30-day trends before you act. A one-day swing is usually just noise. But a steady drop in review velocity, or a lasting decline across several keywords, is a signal worth taking seriously.
Key takeaways for tracking market share over time
Market share gaps usually show up in the data before they hit revenue. Missing keywords, slower review growth, thinner sponsored presence, and a smaller category footprint all act as early warning signs.
Each score should point to a next step. Keyword gaps lead to listing updates. Review pace gaps point to onboarding fixes. Ad gaps call for focused spend tests on queries that already show promise. Category reach gaps usually mean it's time for careful positioning work in nearby use cases.
Track review gains, ranking shifts, and visibility together. The trend matters more than the raw total. Re-score the same gaps on a set schedule so you can see whether your market-share position is moving in the right direction. AppJubilee's daily keyword tracking, competitor alerts, and listing change impact analysis help tie specific actions to measurable outcomes, so the plan gets better with each cycle.
FAQs
How do I know which gap to fix first?
Use your AJ Score to spot where your visibility falls short against competitors.
Start with your core keyword gaps. Focus on terms that 40% or more of competitors rank for. Then work on moving page-two keywords onto page one for the fastest gains. After that, check AppJubilee’s Keyword Opportunities tab to find long-tail terms your competitors rank for but you don’t.
What if my app is new and has very few reviews?
New apps need early momentum. A good target is 10+ reviews in the first 30 days. Why? Because review velocity often matters more than total review count.
In plain English, a steady flow of new reviews can do more for your app than a bigger review total that came in months ago.
A simple way to improve your odds is to ask for reviews 7–14 days after install. That timing gives people enough time to try the app without waiting so long that the request feels random or easy to ignore.
It also helps to go after niche or problem-based keywords where the top apps have fewer than 200 reviews. That’s usually a smarter play than chasing broad terms where established apps already dominate.
And don’t let your listing sit still. Update your copy every 30–60 days to keep it current and active. If you’re eligible, Built for Shopify certification can help too.
How often should I check these market share signals?
Check them weekly so you can catch ranking drops early and react before competitors gain ground.
Most tools refresh data every night, but day-to-day movement is often just noise. That’s why it makes more sense to watch 7-day or 30-day trends instead of obsessing over single-day changes. You’ll get a much clearer view of what’s actually shifting.
If you use AppJubilee, alerts can help you respond within 24 hours.