
Negative Review Trends: Competitor Analysis
Track 30/90/180-day negative review patterns across Shopify apps to spot repeat complaints, release spikes, support failures, and billing friction.
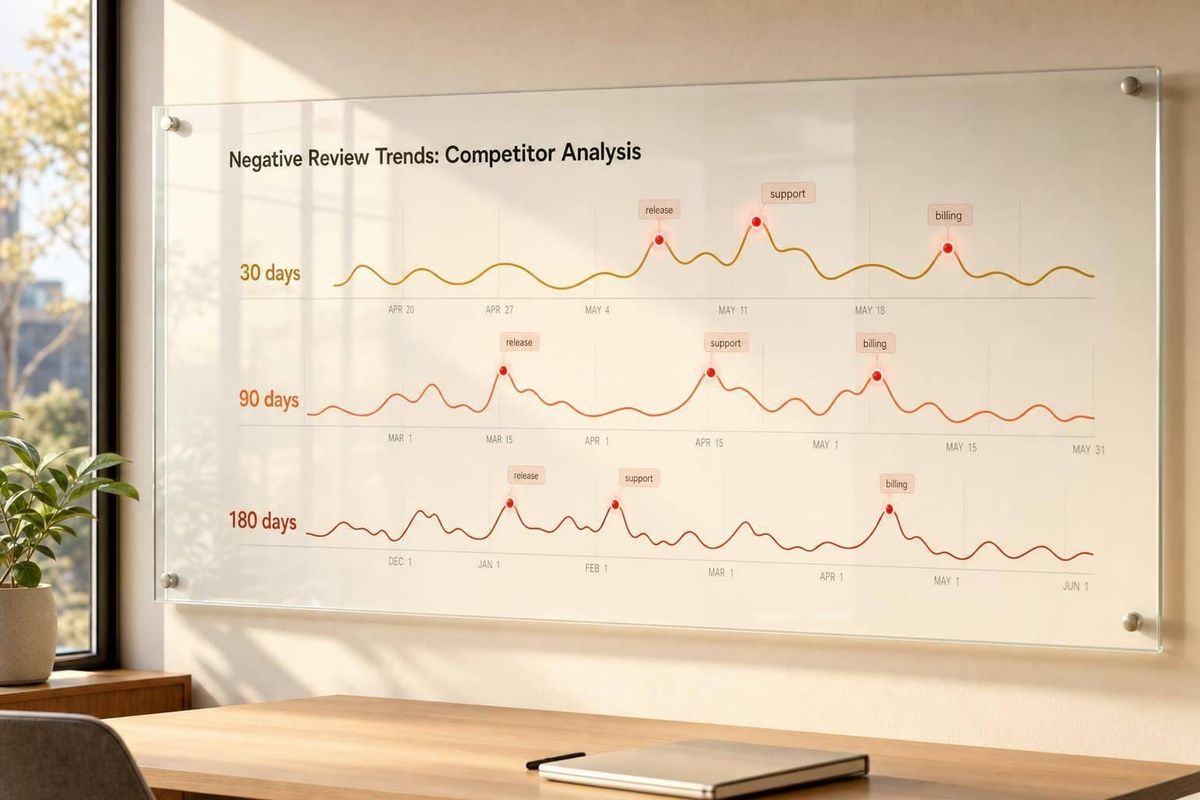
Negative reviews tell you where competitors are weak right now. As of August 22, 2026, the clearest patterns across Shopify apps come from 1-star to 3-star reviews tracked over 30, 90, and 180 days.
If I were comparing rivals with Shopify App Store keyword research, I’d focus on four things first:
- Repeat complaint themes like setup problems, broken syncs, missing features, and billing confusion
- Rating drops after updates that trigger short bursts of low-star reviews
- Support problems such as slow replies, canned answers, and unresolved tickets
- Pricing and billing issues like surprise charges, unclear tiers, and forced upgrades
Here’s the short version:
- Direct competitors often get hit by the same product and reliability complaints again and again
- Fast-growing challengers tend to see sharper short-term swings after releases, pricing changes, or growth pushes
- Established leaders usually deal with slower, repeated friction around support, pricing, and product complexity
- Raw ratings alone miss the point; the better view is the share of negative reviews by complaint type over time
- In one cited review set, 38.5% of 1-star and 2-star reviews mentioned support
- In another dataset, 22% of negative reviews mentioned billing, subscriptions, or paywalls
Competitor review analysis powered by A.I.
sbb-itb-ce93587
Quick Comparison
| App group | Main negative pattern | What to watch most |
|---|---|---|
| Direct competitors | Repeat issues with features, setup, and reliability | Whether the same complaint keeps showing up across all three time windows |
| Fast-growing challengers | Sharp bursts after launches, updates, or plan changes | Whether 1-star and 2-star reviews jump far above the 30-day baseline |
| Established leaders | Slower but repeated friction with support and pricing | Whether complaints stay present over 90 and 180 days |
The main takeaway is simple: short spikes often point to a single event, while repeat complaints usually point to a deeper problem. That’s the lens I’d use to judge which competitor issues matter and which ones are just fake reviews or noise.
1. AppJubilee
AppJubilee tracks negative review trends across competitor apps over time. It groups reviews into topic clusters and follows weekly sentiment, so teams can focus on patterns that stick around instead of random noise. From there, the signal splits into the four patterns that matter most: complaint clusters, update-related drops, support issues, and pricing friction.
Complaint clusters
AppJubilee surfaces repeated merchant complaints like "doesn't work with my theme," "unexpected charge," or "no reply from support," and ties them to each competitor app. That makes it easier to see if a spike in one issue is limited to a single app or showing up across the category.
Update-related drops
When a competitor updates its listing, such as pricing or listing copy, AppJubilee flags the change as a possible confounder. If the update lands in the same 7-day window as a review shift, the platform's "Warnings" column marks the overlap. When ratings fall after a release, that overlap helps teams tell the difference between a product issue and plain review noise.
Pricing complaints
AppJubilee detects competitor pricing changes and links them to review sentiment and ranking shifts. In U.S. listings, recurring USD charges often show up in complaints about unexpected charges, billing confusion, tier limits, and forced upgrades. That helps teams see whether pricing pressure is just a one-off complaint or a recurring weak spot for a competitor.
That same setup also makes side-by-side rival comparisons much easier, especially when negative review patterns start to split in different directions.
2. Direct Competitor Apps in the Same Shopify Category

Direct competitors solve the same merchant problem for the same Shopify audience. So the comparison has to stay like-for-like. Once you’ve narrowed the field, the next job is simple: look at which rival apps keep drawing the same complaints over time.
Complaint clusters
Across rival apps, the big thing to watch is whether a complaint shows up in just one app or across the whole category.
The most common complaint themes are:
- Missing features or broken workflows
- Onboarding confusion
- Integration failures
- Support response speed
- Billing surprises
When the same issue keeps showing up across 30-, 90-, and 180-day windows, that points to a lasting weak spot. And when those repeat complaints appear across direct rivals, you’re not looking at a one-off vendor problem. You’re looking at a category gap.
Update-driven drops
Rating drops tied to app releases tend to follow a clear pattern. You’ll often see a short burst of one-star reviews with phrases like "after the latest update" and "the new version broke X", then one of two things happens: the app recovers, or the decline keeps going based on how fast the vendor steps in.
A short spike usually signals a release issue. A longer slide points to a deeper product problem.
To sort signal from noise, match review timestamps against changelog dates. That helps separate regressions from random bad reviews.
Support issues
Support complaints across rival apps usually pile up around onboarding, billing events, and post-update bugs.
Merchants often describe the same kinds of problems:
- Tickets sit unanswered for days
- Replies feel generic and miss the actual issue
- Support gets bounced between teams
The key is to check whether the problem is isolated or keeps repeating across several rival apps. A fast fix can contain the damage. Slow, vague support does the opposite. It turns one bug into a longer negative trend.
Pricing friction
Pricing complaints usually fall into two buckets: the price itself and unclear or unexpected pricing behavior.
The sharpest negative clusters usually come from pricing behavior, not just cost. That includes free-trial conversions that auto-charge without warning, usage fees that show up only after a merchant hits a tier limit, or required add-ons that weren’t visible during signup.
These complaints tend to cluster around plan changes, feature gating, and billing interactions. That makes them easy to track as a repeat weak spot for a competitor. It also makes pricing trends easier to compare across rivals in the next section.
These patterns matter most when you compare how often each rival repeats them and how fast it recovers.
3. Fast-Growing Challenger Apps
Compared with direct rivals, challenger apps tend to show faster, sharper complaint spikes. Instead of a slow buildup over time, you usually see review surges tied to launches, pricing changes, or big marketing pushes. That’s the part that matters most: the pattern often tells you more than the average product review rating.
Complaint clusters
In fast-growing challenger apps, negative reviews often bunch up around early product gaps and scaling strain. Merchants talk about crashes and data sync failures as store volume grows. They also mention integrations breaking when discounts are active or when multi-location inventory comes into play. And setup can be a pain point too, especially when the flow feels too technical for the average merchant.
Another pattern shows up again and again: the gap between marketing and the actual product. Reviews saying the app didn’t match the marketing often appear when a growth-focused landing page sells a bigger story than the product can deliver at launch. With mature apps, complaints are usually spread across many months. With challenger apps, they land in tighter windows, which makes each cluster easier to spot and much harder to brush off.
The same kind of burst often appears right after releases.
Update-driven drops
Challengers ship fast, and that pace creates a direct problem: updates can break things that were already working. When merchants start saying a new version caused new bugs, that’s not just bad luck.
A key signal to watch is whether a new version leads to a 2–3x jump in 1–2 star reviews compared with the 30-day baseline. When that happens, it usually points to a deeper product issue, not random noise.
Support issues
Support complaints in challenger apps usually sound familiar: slow follow-up, no clear escalation path, and chatbots that never get the merchant to a real person. Negative reviews also point to cases where merchants are left stuck with unresolved billing or data-loss issues. If support sentiment keeps sliding over a 30-day period, that usually signals a scaling problem rather than a short rough patch.
And support isn’t the only pressure point. Billing changes often trigger the next burst of complaints.
Pricing friction
Pricing changes tend to show up fast in challenger reviews. Usage-based pricing tied to order volume or contact counts can catch merchants off guard, especially if they didn’t expect costs to grow as their store grew. “Free to install” messaging followed by unexpected USD charges in Shopify billing creates some of the sharpest negative clusters.
The pattern is pretty clear: pricing complaints often arrive in bursts after each plan change, which makes those moments easy to track over time.
4. Established Category Leaders
Challengers often swing up and down in bursts. Category leaders usually don’t. Over 30-, 90-, and 180-day windows, their complaints tend to move more slowly and stick around longer. Instead of sharp spikes, you’ll usually see recurring friction tied to scale, support, and billing.
That review pattern looks different for a reason. Leaders tend to get fewer complaints about launch bugs and more about day-to-day friction: scale, workflow complexity, support quality, and pricing. You can spot that change most clearly in complaint clusters, release-linked rating drops, support friction, and pricing complaints.
Complaint clusters
For established leaders, negative reviews often pile up around pricing, support, onboarding, and long-running product issues. That includes legacy UI complexity, rigid workflows, and slower performance at higher volumes.
Over longer time windows, these issues stop looking like one-off flare-ups and start looking like repeating patterns. Compared with challengers, leaders usually get fewer complaints about buggy new features and more complaints tied to product maturity.
Update-driven drops
Big releases can still cause short rating drops, especially when they change core workflows, pricing, or integrations. A brief spike often points to a release problem. A longer slide usually signals a deeper regression.
One detail matters a lot here: version tags in 1- and 2-star reviews posted within 24–72 hours. That’s a strong sign the release is behind the decline.
Support issues
Support complaints usually focus on slow escalation, weak ownership of complex issues, and limited Shopify expertise for multi-store setups or advanced discount configurations. Reviews often mention waiting three or more days for a response, tickets bouncing between departments, or unresolved issues inside revenue-critical workflows.
You’ll also see the same language repeat in mature-app complaint clusters. Keywords like "poor support", "no response", and "unprofessional" show up often.
Pricing friction
Pricing complaints for established leaders usually come down to value, billing clarity, and the cost of scaling. Merchants point to hidden charges, rigid plans during seasonal spikes, and billing models that weren’t clear during onboarding.
These complaints often jump after price increases or changes to free-plan limits. That repetition matters, because the pattern gets more useful when you compare how often each rival runs into the same problem.
How Negative Review Trends Compare Across Rival Apps
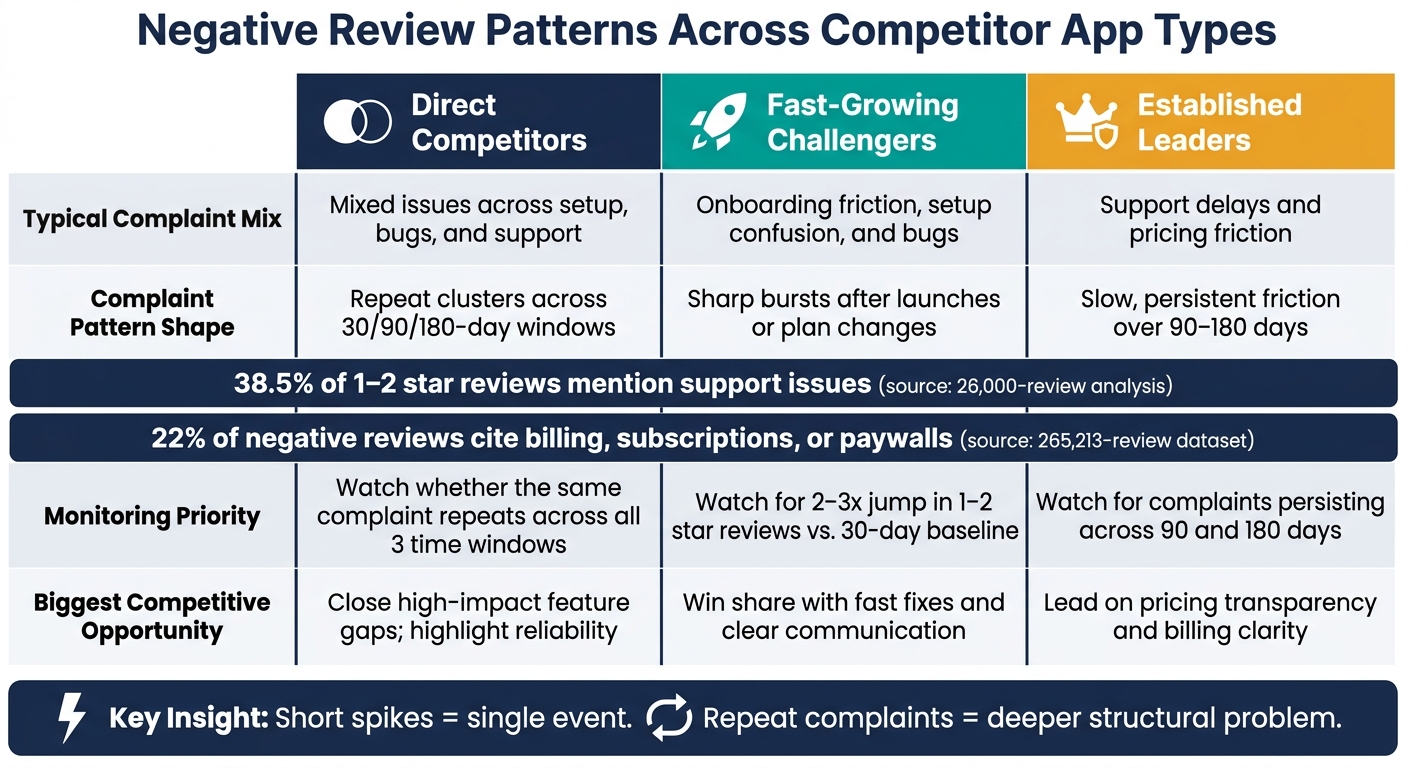
Negative Review Patterns: Competitor App Types Compared
Raw star ratings don't tell you much on their own. A 3.9 vs. 4.2 score can look dramatic, but it doesn't explain why merchants are unhappy or whether those problems are getting better or worse.
The fair way to compare rival apps is simpler than it sounds: use the same review windows, the same complaint taxonomy, and the share of negative reviews instead of raw counts. AppJubilee helps standardize competitor mapping and daily tracking, which makes side-by-side comparisons much cleaner. Done this way, you can spot which rival groups are weakest in onboarding, reliability, support, or pricing.
Complaint Clusters by App
Negative reviews usually fall into a few familiar buckets: bugs and reliability, onboarding friction, missing features, setup confusion, and support delays. Newer apps tend to lean more heavily toward setup and stability complaints. More mature apps usually draw more heat around support and pricing friction.
A useful comparison tracks each complaint cluster across 30-, 90-, and 180-day windows, then compares the share of negative reviews in each bucket.
| Metric | Direct Competitor | Fast-Growing Challenger | Established Leader |
|---|---|---|---|
| Typical complaint mix | Mixed issues across setup, bugs, and support | More onboarding friction, setup confusion, and bugs | More support delays and pricing friction |
| Trend to watch | Whether one cluster is accelerating | Whether setup and reliability complaints are rising | Whether support and pricing complaints are becoming more common |
| Representative phrases | Missing basic reporting; sync issues | Setup instructions are unclear; wizard is hard to follow | Slow to resolve issues; pricing feels too high |
In one analysis of 26,000 one- and two-star Shopify app reviews, 38.5% referenced support issues, about 18% mentioned technical bugs, and roughly 13% cited billing issues. That split helps you see the real story. One app may be struggling with setup, while another is getting dragged down by support.
Update-Related Rating Drops
The cleanest way to spot update-related problems is to tie reviews to release dates. Compare negative-review counts and average ratings in the 14- to 30-day period before and after a major release. Then look for phrases tied to a new version, broken workflows, or UI changes.
A short spike often points to a rollout problem or an interface change that landed badly. A drop that sticks around for 60 to 90 days usually signals a deeper regression that slipped through.
| Metric | What to compare |
|---|---|
| Pre-release negative-review count | Baseline before the update |
| Post-release negative-review count | Whether the release triggered a spike |
| Average rating change | Size of the drop after release |
| Trend direction | Temporary dip or longer decline |
| Post-update phrases | Phrases about a new version, broken workflows, or UI changes |
These windows help separate release regressions from normal review noise. After that, you can check whether the damage was a one-off spike or part of a recurring release pattern.
Support Problems Across Competitors
Support complaints are one of the most persistent themes in negative Shopify app reviews. In the same 26,000-review analysis, 38.5% of one- and two-star reviews referenced support issues.
Challenger apps often get hit for no response, outdated documentation, or support that leans too much on canned replies. More established apps tend to face complaints about slow escalation, tickets getting passed from team to team, and unresolved issues tied to revenue-critical workflows.
| Metric | What to compare |
|---|---|
| Support-related negative-review count | How often support appears in dissatisfied feedback |
| Share of support complaints | Whether support is a major driver of negatives |
| Trend direction | Whether support problems are improving or worsening |
| Response-time complaints | Whether merchants feel ignored or stalled |
| Resolution-quality phrases | Whether tickets are actually being solved |
That makes support one of the clearest ways to compare apps side by side.
Pricing and Billing Friction
Billing complaints are another major source of negative reviews. In a broader dataset of 265,213 negative app reviews, billing, subscriptions, and paywalls made up 22% of all complaints. These issues often flare up after plan changes, free-tier limit adjustments, or surprise charges.
The best signals here are concrete. Look for merchants mentioning plan tiers, overage fees, charges that continued after uninstalling, or pricing pages that feel unclear.
| Metric | What to compare |
|---|---|
| Pricing-related negative-review count | How often money-related friction appears |
| Share of pricing complaints | Whether pricing pressure is growing |
| Trend direction | Whether billing friction is rising or easing |
| Plan and limit concerns | Which tiers or thresholds cause complaints |
| Pricing-related phrases | Where merchants are confused about charges, limits, or value |
These signals help you identify the main failure mode: onboarding, reliability, support, or pricing.
Pros and Cons of Each Competitive Review Pattern
Once you've spotted the main complaint types, the next step is simple: which pattern creates the bigger competitive threat? That depends on what the pattern is telling you.
Some patterns point to a one-time event. Others point to a deeper problem.
An isolated spike usually ties back to something specific, like a bad release, a pricing change, or an outage. It shows up fast, drags ratings down for a bit, and may fade once the issue gets fixed.
A persistent pattern tells a different story. The same complaints keep showing up month after month. That's usually a sign of a deeper weakness that the team still hasn't fixed.
Short spikes call for a fast response. Persistent themes call for product or policy changes.
The table below shows what each review pattern tends to signal, what it can mean from a competitive angle, and how closely you should watch it.
| Review Pattern | What It Signals | Competitive Implication | Monitoring Priority |
|---|---|---|---|
| Isolated spike (post-release) | A rollout problem or interface change that landed badly | Short window to gain visibility if the rival is slow to recover | High - timing matters; the window closes once the rival patches the issue |
| Persistent complaint cluster | A structural weakness the team hasn't resolved | A positioning gap you can speak to directly in your own listing | Very High - recurring themes set category expectations and erode trust over time |
| Support complaint surge | Scaling strain or a breakdown in ticket handling | Merchants actively looking for alternatives with better support | High - support sentiment shifts can accelerate uninstalls and negative review velocity |
| Pricing friction spike | A plan change, billing surprise, or unclear tier structure | Merchants reconsidering value, especially after a price increase | High - pricing complaints often cluster tightly and spread quickly across reviews |
| Slow, steady rating decline | Accumulated friction with no clear fix in sight | The rival is losing ground without a visible recovery plan | Very High - gradual declines are harder to reverse and signal deeper product or support issues |
The main takeaway is to separate short-lived spikes from recurring themes. That split helps you decide which rivals need close, immediate monitoring and which ones only need a periodic check.
Conclusion
When you compare rival apps, the pattern tells you more than the raw star rating. Negative reviews don't all mean the same thing. A short-lived spike is one thing. A pattern that keeps showing up is another. That’s the split that matters: temporary trend vs. persistent trend.
Each competitive tier comes with its own main risk. Fast-growing challengers often hit scaling pressure. That usually shows up as bugs, support delays, and uneven performance. Established leaders tend to build up friction in other areas, especially pricing, billing, and perceived fairness. Direct competitors often reveal complaints around feature gaps and reliability.
Use the summary below to sort short-term noise from repeat weak spots.
| Subject | Biggest Review Risk | Biggest Competitive Opportunity | Recommended Next Action |
|---|---|---|---|
| Direct Competitor Apps | Persistent complaints about missing features and reliability | Closing high-impact feature gaps that show up repeatedly in negative reviews | Prioritize fixes based on review clusters and highlight proven reliability in listing messaging |
| Fast-Growing Challengers | Scaling bugs, support delays, and inconsistent performance eroding early trust | Winning share with fast fixes and clear communication | Invest in QA, staged rollouts, and scalable support |
| Established Category Leaders | Long-running dissatisfaction with pricing, billing, and inflexibility | Leveraging brand trust to lead on transparency and modern review intelligence | Reassess pricing structures, clarify billing terms, and use review monitoring to detect rising discontent early |
Move fast when review spikes hit. But put your bigger bets on the patterns that keep coming back. Teams that watch both can turn competitor weak spots into lasting gains.
FAQs
How do I tell a short-term review spike from a deeper product problem?
Don’t judge a business by a single day’s rating change. Look at review velocity instead. That shows you whether negative reviews keep coming in over time, and whether clusters of bad reviews tend to show up before ranking drops.
You’ll also want to check for confounders. For example, did the listing change during that same 7-day window? If so, the ranking drop may not be tied to reviews alone.
Then look at repeat complaint themes, such as onboarding, pricing, and support. If the same issues show up again and again, you’re likely dealing with a persistent problem instead of a one-off spike.
Which negative review themes matter most when comparing Shopify apps?
Pay close attention to recurring themes around onboarding, pricing, and support. These areas tend to show up again and again in review sentiment analysis, and they’re far more useful when you track them over time instead of treating each comment like a one-off complaint.
When negative feedback starts to cluster, that can signal a deeper system issue rather than random user frustration. It also helps to check whether those patterns line up with drops in search visibility and keyword rankings when you benchmark against competitors.
What time window should I use to compare negative review trends?
Use rolling 7-day windows to compare negative review trends.
For each review, compare your app’s rank or visibility - and each competitor’s - from the start of that review’s 7-day window to the end. Then look at those patterns over time.
This makes it easier to spot clusters of complaints and repeated drops.
In AppJubilee, Review → Rank Impact uses the 7-day period after a review is posted. Ranking movement is then compared across crawls that are 7 days apart.