
Keyword Trend Data for Shopify ASO: Guide
Track 7- and 30-day Shopify App Store keyword trends: set baselines, compare competitors, and tie rank changes to installs.
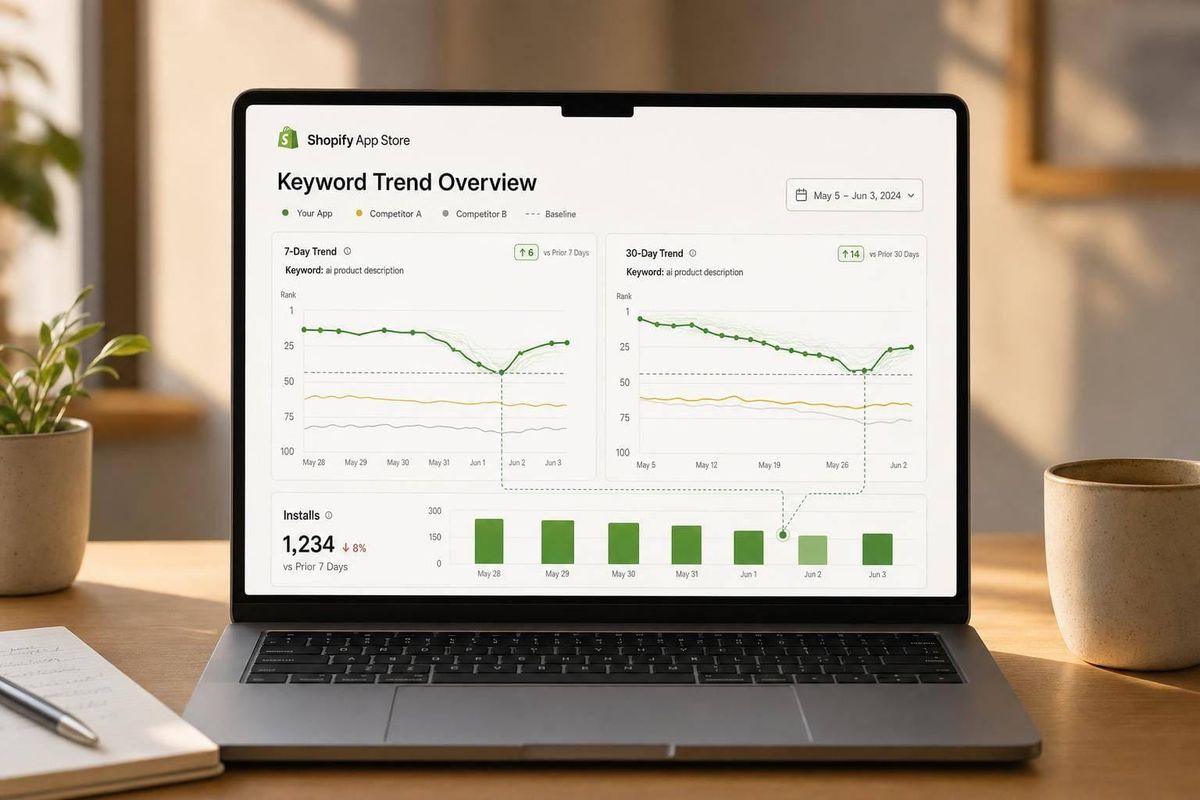
If I want better Shopify App Store rankings, I don’t look at one rank check. I look at the trend. A single position tells me where I am today. A 7-day and 30-day view tells me if I’m moving up, slipping, or just seeing noise.
Here’s the short version:
- I set up tracking before I edit my listing
- I keep the same keyword set and market scope
- I watch rank, trend direction, competitor movement, installs, and conversion rate
- I compare daily signals with weekly and monthly patterns
- I match rank changes to listing edits, review spikes, releases, and seasonality
- I check whether a rank move led to more traffic and installs
A few numbers matter right away. Small daily rank swings of 1–2 spots are common. A sharp drop across many keywords at once is more serious. And tracking about 1,200 Shopify App Store keywords daily gives a much clearer view than random spot checks.
What I take from this guide is simple: don’t react to noise. I use a fixed baseline, read trends over time, compare my app to 3–5 direct competitors, and review the data on a set rhythm: daily for alerts, weekly for trends, monthly for keyword decisions.
If I do that, each listing change becomes a test instead of a guess.
Set up keyword tracking before editing your listing
Before you edit your listing, set a baseline first. That way, if rankings move, you can link the shift to the edit instead of random timing noise. Start with your keyword set, then log the baseline before anything changes.
Choose a stable keyword set and market scope
Build your keyword list around four term types: brand keywords (your app name and brand variations), category keywords (broad discovery terms like "inventory management" or "email marketing"), feature keywords (specific capabilities like "abandoned cart recovery"), and problem-based keywords (intent-driven phrases like "reduce shipping errors"). This mix gives you a clearer read on what changed. Did the listing update help broad visibility? Did it strengthen branded searches? Or did it shift performance in a tighter, higher-intent slice?
Start with a fixed set of core, problem, feature, and test keywords. Then leave that list alone. If you swap terms in and out, your week-over-week comparison stops being clean.
For a U.S.-focused app, a solid starting set usually includes:
- Core keywords tied to your main user need and category
- Problem or feature terms
- A few emerging terms, like mobile app builder, you want to test
Track every keyword in the same market: Shopify App Store, U.S., English. Use U.S. English spelling across the board, such as "customization" instead of "customisation." If you mix locales in one dataset, comparisons get shaky fast.
Record a baseline and annotate every listing change
Once your keyword list is set, capture a baseline before you touch the listing. Record the current rank for every tracked keyword, the date and time of the capture, your app's current title, subtitle, description, screenshots, price in USD, and app version. Also log impressions, click-through rate, and install rate for the same date range. This is your "before" snapshot, and you'll use it to judge what happened after the edit goes live.
Then annotate every change. The more specific, the better.
"Aug. 27, 2026: Updated title to include 'inventory sync'; replaced first two screenshots; price unchanged."
That kind of note matters because ranking effects don't always show up right away. And when changes overlap, things can get messy. A review spike in the same week as a title update can blur the picture if you didn't mark both.
At a minimum, log changes like these:
- Metadata edits
- Screenshot replacements
- Pricing changes
- New releases
- Review spikes
- Seasonal campaigns like Black Friday or back-to-school pushes
Each of these can affect rankings or install volume on its own.
With the baseline in place, the next step is picking the metrics that tell you whether movement is actual or just noise.
sbb-itb-ce93587
Pick the right metrics and read trend patterns correctly
Core metrics to track for each keyword
Once you’ve logged your baseline, the next step is simple: watch the metrics that tell you whether a ranking change is actual movement or just noise.
| Metric | What It Reveals | The ASO Question It Answers |
|---|---|---|
| Rank position | Your exact spot in search results (for example, #3 vs. #15) | Is my app visible for this keyword today? |
| Rank velocity | How fast your position is changing (for example, #20 → #10 in 7 days) | Is this keyword moving up or down? |
| Trend chart | Rank plotted over 7–90 days | Is this keyword stable, volatile, or improving? |
| Search demand signals | Estimated search volume, impressions, and clicks from keyword and analytics tools | Does ranking here drive meaningful traffic? |
| Keyword difficulty | How hard it is to rank based on competitor strength | Should I invest in this term or target easier opportunities first? |
| Competitor movement | Which rivals are gaining or losing for the same keyword | Is my rank shift driven by my own changes or by competitor actions? |
Rank position and rank velocity work best as a pair. A keyword sitting at #12 and climbing 2–3 spots per week is often a better bet than a keyword stuck at #25. Why? Because the first one is getting close to the point where merchants start clicking. The second may be telling you something else: your listing and that keyword may not line up well.
After you know which signals to watch, read them across both short and longer windows.
How to read 7-day and 30-day rank movement
Use 7-day movement to spot what’s changing. Use 30-day movement to see if that change sticks.
Here’s how the most common patterns tend to look:
Steady improvement - say #18 → #14 → #11 → #9 over 7 days - often means a recent listing update is lining up better with search intent. It can also mean positive reviews are slowly helping relevance. If that same climb holds across 30 days, you can treat it as a real gain. At that point, it makes sense to tighten your copy around that keyword and check that your screenshots and feature descriptions line up with what searchers expect.
A sudden jump - like #20 to #7 overnight - looks great, but don’t rush. It could come from a major listing update, a competitor falling back, a burst of installs, or a Shopify algorithm shift. Give it 7–14 days. If the 30-day chart settles into a stable plateau near that new position, the gain is likely real. If it drifts back toward #18–#22, you were probably looking at noise.
A gradual decline over 7 days - for example, #5 → #7 → #9 → #11 - becomes much more serious when it keeps going across 30 days. That usually points to stronger competitive pressure or a listing that no longer fits the keyword’s intent as well as it used to. In that case, a quick copy edit probably won’t do much. You’ll want to look at what the top-ranking competitors changed.
Flat performance - staying around #15–#17 for weeks - often means your listing is decent enough to hold position, but not strong enough to move higher. Small edits usually don’t shift much here. Bigger levers tend to matter more, like getting reviews that mention the keyword’s use case or improving onboarding so your ratings get better.
"Single-day position data should be treated as a point-in-time snapshot. Trends over 7 or 30 days are more reliable signals of actual ranking movement." - AppJubilee Methodology
How to avoid false conclusions from noisy data
Before you react to a drop, check whether it’s a one-off event or part of a bigger pattern.
A single-day ranking drop is almost never a reason to rewrite your listing. Shopify App Store rankings move every day for reasons you can’t fully control: day-of-week demand shifts, minor algorithm recalibrations, short competitor promos, or tracking lag. A move from #4 to #7 on a Tuesday can look dramatic on its own and mean nothing by Thursday.
That’s why it helps to check nearby keywords, competitor movement, and your annotation log before doing anything. AppJubilee's listing change impact tracking can help flag those overlaps, so you can see when attribution gets messy.
The practical rule is straightforward:
- Observe daily
- Investigate at 7 days
- Decide at 30 days
The one exception is when the drop is severe and shows up across several keywords at the same time.
Benchmark competitors and connect rank changes to installs
Once a rank move looks real, compare it against competitors and install data.
Map shared keywords, gaps, and visibility shifts
After you confirm a rank shift is real, the next step is simple: figure out whether the change came from your listing or from competitor movement.
A jump to #12 doesn't tell the whole story on its own. If a rival sits at #4 and is still climbing, that rank is under pressure. If the rival is at #18 and slipping, the picture looks very different.
Start with a core competitor set of 3–5 apps in the U.S. market. Pick apps that go after the same main use cases, price range, and merchant segments. Then compare your rankings against theirs across a shared keyword set using Shopify app keyword research tools. That set should include:
- category terms
- problem-solution phrases
- high-intent queries
Once the data is in place, sort each keyword into three buckets: shared (both you and a competitor rank in the top 50), gaps (competitors rank in the top 20 while you rank below position 40 or don't show up at all), and strongholds (you rank much higher than rivals).
Gaps often offer the fastest route to more installs. Why? Because merchants are already searching those terms and finding your competitors instead of you.
| Keyword | Your Rank | Top Competitor | Competitor Rank | Your Trend (30-Day) | Competitor Trend | Rank Gap |
|---|---|---|---|---|---|---|
| subscription app | 9 | Competitor A | 3 | ↑ from 15 | → stable | −6 |
| preorder | 22 | Competitor B | 5 | ↓ from 12 | ↑ from 9 | −17 |
| bundle builder | 4 | Competitor C | 18 | ↑ from 8 | ↓ from 10 | +14 |
Use the gap column to spot where visibility is slipping away. A −17 gap on "preorder", paired with your downward trend and their upward trend, points to a deeper visibility issue, not normal day-to-day fluctuation. Historical views help you tell the difference between a long-running gap and a new loss. Alerts help you catch rivals breaking into the top 10.
Rank gaps matter most when they start showing up in installs and conversion.
Tie rank movement to installs, conversion rate, and listing edits
A move from #15 to #7 matters most when it leads to more impressions, more installs, and a better conversion rate.
Overlay keyword rank history with Shopify Partners installs and GA4 source data. Use Shopify Partners for impressions, installs, and conversion rate. Use GA4 to separate organic app store search from browse and referral traffic. When a rank gain for a high-intent keyword comes right before a lift in app store search traffic, attribution gets much cleaner.
AppJubilee pulls GA4 and Shopify Partners data into one place, which cuts down the manual work of stitching together spreadsheets.
Your change log adds another layer of clarity. Put listing updates on the same timeline as rank and install data:
- title edits
- new screenshots
- pricing changes in USD
- release updates
That side-by-side view makes patterns easier to spot. If a title keyword edit is followed by rank gains, the metadata likely helped. If screenshots improve conversion while rank stays flat, then the lift is coming from creative, not ranking. AppJubilee's listing change impact tracking is built for this kind of comparison, especially when a listing update and a review surge happen in the same 7-day window.
Check competitor activity before blaming your own changes for a drop. If rank and installs fall while a competitor launches a major feature, updates its listing, or gets a burst of positive reviews, part of that change likely comes from their momentum. AppJubilee's competitor alerts and ranking snapshots give you the context you need to separate those effects.
Feed these comparisons into your weekly review cadence.
Build a weekly review process
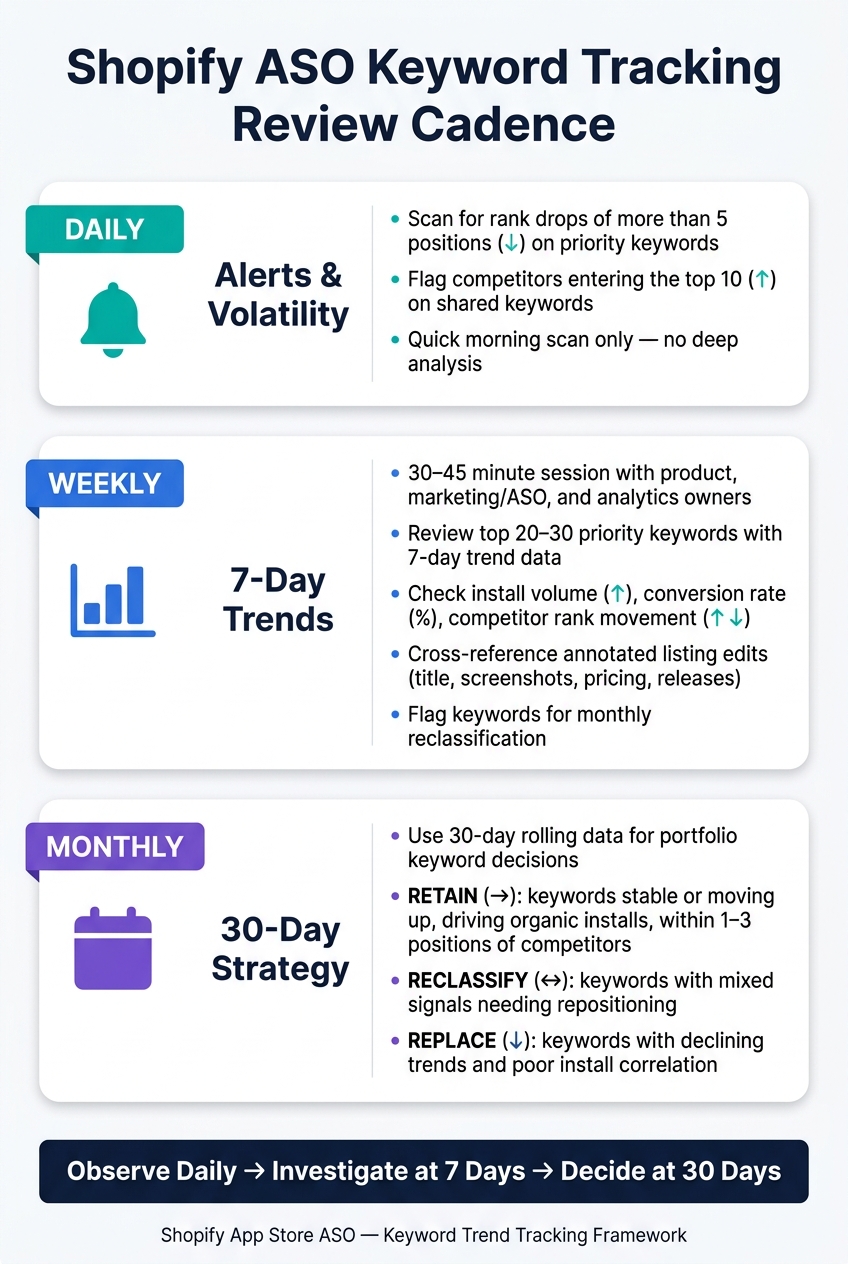
Shopify ASO Keyword Tracking: Daily, Weekly & Monthly Review Cadence
Once rank, install, and competitor changes sit on the same timeline, you can turn raw data into clear decisions. The key is a fixed review cadence.
A practical review cadence for Shopify app teams
Use three time horizons to keep this work under control without missing key shifts.
Daily, check alerts only. Set alerts for rank drops of more than 5 positions on top-priority keywords and for competitors entering the top 10 on shared keywords. A fast morning scan is usually enough.
Weekly, spend more time on the details. Run a 30–45 minute session with the owners from product, marketing/ASO, and analytics. Review your top 20–30 priority keywords with 7-day trend data. Then check install volume, conversion rate, competitor rank movement, and listing edits. Pull in your change log too, so you can see whether recent updates had the effect you expected. This is also the right time to flag keywords for monthly reclassification.
Monthly, step back and look at the bigger picture. Use 30-day rolling data to make portfolio calls: retain, reclassify, or replace keywords based on the trend data you’ve already gathered. Keep keywords that are stable or moving up, bring in organic installs, and stay within 1–3 positions of key competitors. Replace the ones that don’t.
| Cadence | Primary Focus | What to Do |
|---|---|---|
| Daily | Alerts & volatility | Scan major rank drops and competitors entering the top 10 on shared keywords. |
| Weekly | 7-day trends | Review the top 20–30 priority keywords, install volume, conversion rate, competitor moves, and annotated listing edits. |
| Monthly | 30-day strategy | Retain, reclassify, or replace keywords based on trend and install data. |
AppJubilee's daily keyword tracking, competitor alerts, ranking snapshots, and listing change impact tracking support this exact rhythm. That means your weekly session can stay focused on decisions instead of turning into a data hunt.
Key takeaways
Treat keyword trend review like a recurring operating habit, not a one-off ASO task. Keep a stable keyword set, record a baseline, and use 7-day and 30-day windows instead of reacting to single-day rank checks. Read rank and install shifts next to competitor activity and your annotation log, so each change ties back to a clear action.
FAQs
How many keywords should I track first?
Start with 3–5 low-competition keywords. That gives you a realistic shot at ranking in the top 10 without spreading yourself too thin. Then check performance every week so you can see what’s moving and what’s stuck.
If you use a dedicated tracking setup like AppJubilee, you can go even smaller on day one. The idea stays the same: begin with a short list, learn which terms drive installs, and watch how listing edits change rank. Once you have that signal, expand from there.
How long should I wait before judging a ranking change?
Don’t react to a one-day ranking swing. Intraday movement is often just noise.
A simple rule: review listing changes after 3, 7, and 14 days. Titles and Search Terms are often indexed within about a week. But cleaner ranking patterns and install trends usually take 2 to 4 weeks to settle.
That’s why it makes more sense to watch 7-day or 30-day trends instead of fixating on exact rank positions.
What if rankings improve but installs do not?
If rankings go up but installs stay flat, there’s probably a gap between what people expect and what your listing shows.
In plain English: your keywords may be getting you impressions, but your app page isn’t doing enough to turn that attention into installs.
Use AppJubilee to check whether your click-through rate is below 3% or your bounce rate is high. Those are strong signs that your title or subtitle may not line up with the promise behind your target keywords.