
State of Shopify App Ranks: Daily Trend Study
Daily Shopify App Store rank analysis showing typical ±1–2 position noise, category volatility, and how to read 7–30 day trends.
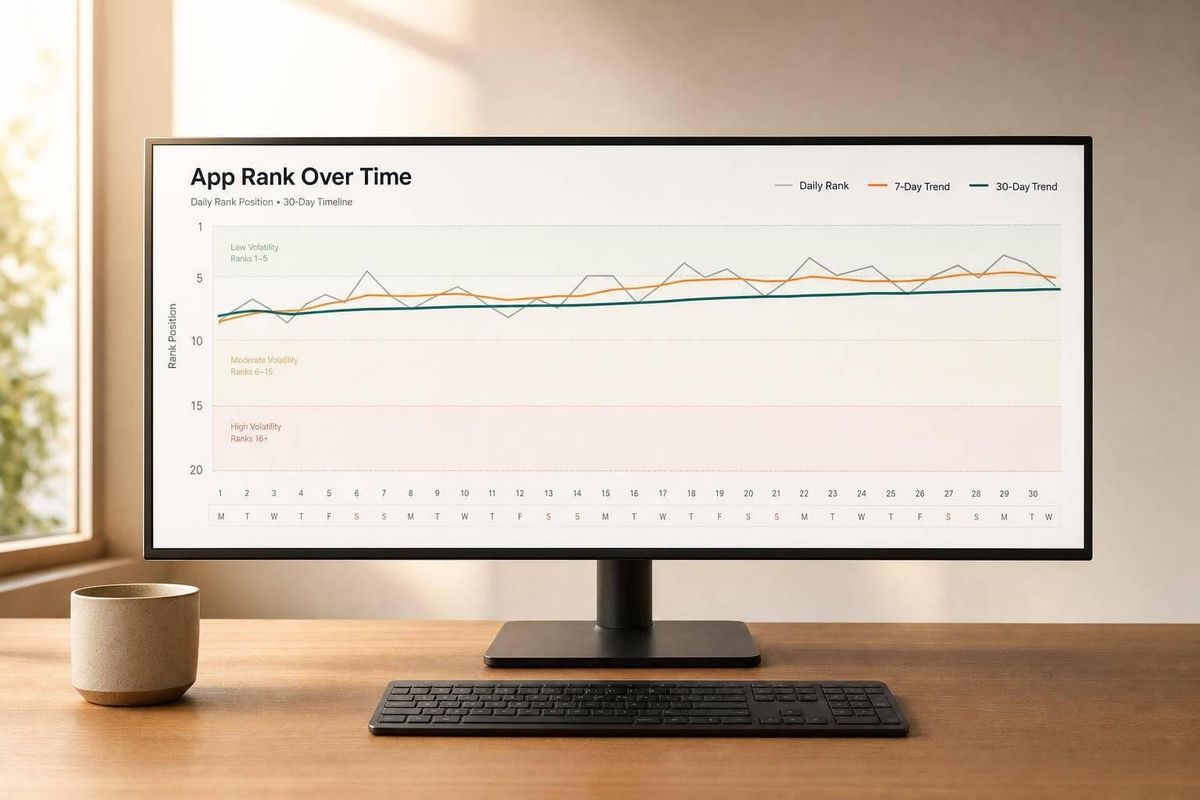
Most day-to-day Shopify app rank moves are small. In this study, I’d read a ±1–2 position change as normal noise, watch ±3–5 if it keeps happening, and treat 3+ straight days in the same direction as the point where I’d look closer.
Here’s the short version:
- I’m looking at daily Shopify App Store rank snapshots from September 1–21, 2026
- The dataset covers 16,595 apps and 2,628 keywords
- The main rank views are keyword rank, category rank, and ad presence
- The best way to read movement is with 7-day, 14-day, and 30-day trends
- Higher-churn terms like “chatbot AI” (5.0) and “WhatsApp” (4.8) moved more over 7 days than steadier terms
- Review bursts often lined up with gains, but they did not prove cause
- Ads held for 3+ days were more useful as a pattern check than as proof of why rank changed
If I were using this study to compare Shopify ASO tools, I’d do three things: set a normal range for each keyword, log every listing or pricing change, and ignore one-day spikes unless they hold for several days.
The core point is simple: don’t react to one snapshot. Use daily history to tell the difference between a blip, a slow drift, and a pattern that sticks.
Study Scope and Data Set
This study is built to separate actual rank movement from day-to-day noise.
It uses daily Shopify App Store rank snapshots from Sep. 1–21, 2026, covering 16,595 apps and 2,628 keywords. The data also includes a curated core set of about 1,200 search terms, from broad queries like "email marketing" to feature-specific terms like "abandoned cart recovery." That matters because it lets the study compare the same app across multiple days instead of leaning on a one-day snapshot.
Not every app or keyword made the cut. To be included, an app had to rank for at least 10 keywords, and a keyword had to have at least 5 apps ranking for it. Those minimums help cut thin-sample noise.
Metrics, Ranking Surfaces, and Comparison Windows
The study looks at three separate ranking surfaces. That split is important because an app can move up in one place and drift down in another.
| Surface | What It Measures |
|---|---|
| Keyword rank | Absolute organic position in search results (position 1, 2, 3, etc.) |
| Category rank | App position within a Shopify browse category |
| Ad presence | Sponsored placements held for 3+ consecutive days |
The main comparison windows are 7 days and 30 days.
How Daily Snapshots Were Collected and Interpreted
Crawls ran once per day, overnight, in a consistent environment. The goal was to reduce geographic, device, and personalization effects. In plain terms, the study tried to keep the measuring stick the same every day.
Positions were logged as raw absolute ranks. There was no averaging and no smoothing. That way, the analysis could compare the same app across multiple days using the same rules each time.
One more point matters here: the data shows correlation, not causation. If a rank shifts, that tells you where to look next. It does not explain why the shift happened. Rank changes should be treated as signals to investigate, not proof of cause.
sbb-itb-ce93587
Daily Rank Movement Patterns
Daily rank changes are usually small. Most apps move a little from day to day, not all at once. The ranges below show the shifts that appear most often.
Most Common Daily Movement Ranges
The most common daily movement is ±1–2 positions. That range is baseline noise. Bigger moves happen less often and usually point to a clear trigger.
| Movement Band | Typical Interpretation |
|---|---|
| ±1–2 positions | Normal daily noise; usually not actionable |
| ±3–5 positions | Small fluctuation; worth tracking if repeated |
| ±6–10 positions | Moderate shift; check for listing, product review, or ad activity |
| 11–25 positions | Significant move; likely event-driven |
| 25+ positions | Major jump; usually tied to a specific trigger |
Volatility also isn’t spread evenly across keywords. For example, "chatbot AI" and "WhatsApp" averaged 5.0 and 4.8 positions of movement over 7 days.
Short-Term Patterns: Drift, 1–3 Day Reversals, and Streaks
The pattern you’ll see most often is gradual drift. Apps tend to move 1–2 spots per day, usually because of stacked effects from listing updates, reviews, or competitor movement.
1–3 day reversals show up a lot too. If an app drops for one day and then snaps back within one to three days, that’s usually temporary noise rather than a deeper change.
The pattern worth the most attention is streaks. When an app rises or falls for three or more days in a row, that’s no longer random day-to-day movement. At that point, it makes more sense to watch the 7–14 day trend instead of reacting to a single-day change.
Put simply, sustained multi-day movement is the stronger signal. Three straight days of gains on "customer service" means more than a one-day spike. These day-to-day patterns also change by category, which the next section compares directly.
Category-Level Shifts and Signal Relationships
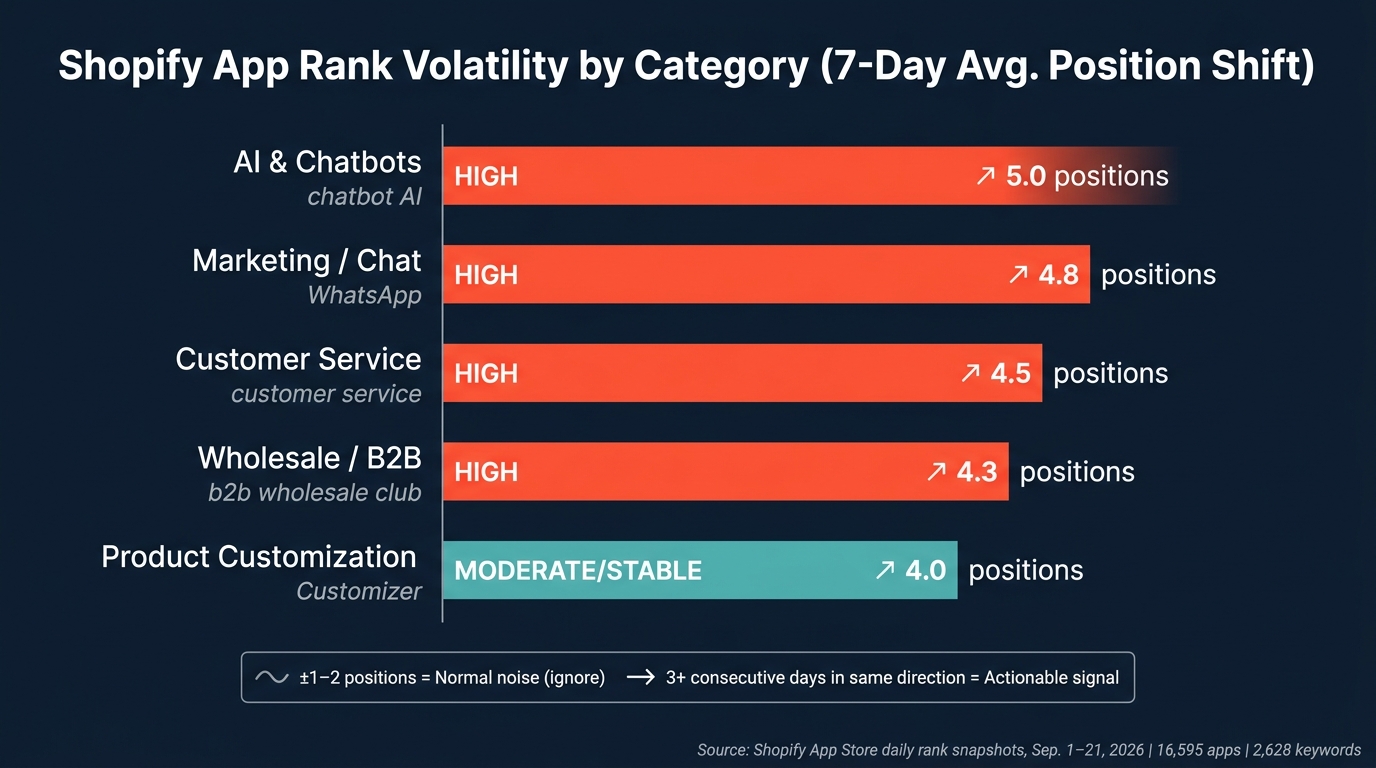
Shopify App Rank Volatility by Category: 7-Day Position Shifts
Which Categories Showed the Most Churn
Daily rank movement isn't spread evenly. The biggest swings showed up in a handful of category groups: AI, chat, customer service, and wholesale/B2B. Those categories had the most 7-day churn. By contrast, mature, saturated terms were steadier, and top spots there didn't move around as much.
| Category | Example Keyword | Avg. 7-Day Position Shift | Volatility Level |
|---|---|---|---|
| AI & Chatbots | "chatbot AI" | 5.0 positions | High |
| Marketing / Chat | "WhatsApp" | 4.8 positions | High |
| Customer Service | "customer service" | 4.5 positions | High |
| Wholesale / B2B | "b2b wholesale club" | 4.3 positions | High |
| Product Customization | "Customizer" | 4.0 positions | Moderate/Stable |
The pattern is pretty clear: newer, fast-growing niches tend to churn more, while saturated categories hold their positions longer and are tougher to break into.
How Reviews and Ads Aligned With Rank Changes
This churn data gets a lot more useful when you look at the signals that tend to move with ranking changes. Review velocity closely tracked upward rank movement. Apps that entered the Top 10 for the first time often had a strong weekly review burst at the same time. One example is Kaching Bundles App & Upsells, which picked up +116 reviews in a week during its climb.
Still, this isn't a clean one-to-one pattern. When a listing update and a review spike land in the same 7-day window, the listing update is the stronger candidate signal. The review spike alone shouldn't get all the credit. AppJubilee marks this overlap so teams don't assign the cause to the wrong factor.
Ad activity follows its own rule set too. Ads are counted only when a sponsored position holds for more than 3 days, which filters out short tests. In high-churn categories, ads often look more reactive than proactive. Teams use them to defend visibility after an organic drop, or to gain ground on keywords where organic rank is weak.
What App Teams Can Learn From Historical Rank Data
How to Use Trend History for ASO Decisions
Once you know that rank changes are usually small and short-lived, the next step is simple: use that history to make better ASO calls.
Daily history helps you tell the difference between normal noise and a shift that actually matters. Start by setting a baseline for each keyword's usual rank range. Daily snapshots show you that range over time. If a keyword moves inside that range, that's normal. If it stays outside that range for several days, you may be looking at a real change.
Use the same approach for listing updates. Before you change a title, description, screenshot set, or pricing, log 7 to 14 days of daily rank data. Then track the next 7 days and 30 days after the change. If rankings improve across several days, that's a signal worth paying attention to. If you see a one-day jump and then things snap back, that's just noise. It also helps to date every change - listing edits, app updates, pricing changes, and ad launches - so you can match rank movement to a specific action.
Things get messier when a review spike lands around the same time as a listing update. In that case, attribution is harder. Timestamps help you check whether the rank move stuck after the burst faded.
That job gets much easier when rank, review, and ad data sit in one place.
Using AppJubilee to Monitor Rank, Review, and Ad Signals
Tracking keywords, listing edits, reviews, and ads by hand takes time, and mistakes creep in fast. AppJubilee is built for this kind of workflow. It offers daily keyword tracking, ranking snapshots, competitor mapping, listing change impact tracking, review intelligence, ad monitoring, and integrations with Google Analytics 4 and Shopify Partners.
The main value comes from looking at rank, reviews, and ads together over time. With AppJubilee, teams can compare a keyword's history before and after a listing update, review spike, or ad campaign. From there, they can connect changes in visibility to installs and revenue.
| Workflow Step | What to Track | AppJubilee Feature |
|---|---|---|
| Pre-change baseline | 7 to 14 days of daily keyword positions | Ranking Snapshots |
| Post-change evaluation | 7- and 30-day rank trends | Historical rank data |
| Review signal monitoring | Weekly review velocity vs. rank movement | Review Intelligence |
| Ad activity correlation | Competitor ad placements on target keywords | Ads Intelligence |
| Business impact validation | Installs and revenue tied to rank changes | GA4 / Shopify Partners integration |
For teams running more than one app, competitor mapping and competitor alerts make it easier to watch shared keywords over time and see which shifts are worth a closer look.
The goal stays the same: spot movement that holds, ignore short-term noise, and act on signals that stick.
Conclusion: What the Study Says About Rank Volatility
One theme showed up again and again in the study: most daily rank changes are small. A move of about ±1–2 positions is usually just noise. What matters more is movement that sticks around for several days. That’s where daily snapshots help - they let you tell the difference between a blip and a pattern.
At the same time, that baseline isn’t the same for every keyword or category. Some terms are much jumpier than others. For example, keywords like "chatbot AI" and "WhatsApp" can move 4.8–5.0 positions in a week. So if you use one baseline for every term, you’ll read the data the wrong way.
It also helps to treat reviews and ads as correlated signals, not direct proof that one thing caused the other.
A single day’s rank is just a snapshot, not a final judgment. Teams that look at 7-, 14-, and 30-day trends alongside the actions they took tend to make better ASO calls than teams that chase every daily fluctuation. The habit that matters is reading the trend, not reacting to the noise.
FAQs
How often should I check app ranks?
AppJubilee updates ranks daily, but it’s smart not to panic over a one-day jump or dip. A lot of those moves are just noise. Instead, watch 7- to 14-day trends to see whether something is actually changing.
For regular check-ins, a weekly review works best for keyword rankings, install counts, and competitor activity. When you’re looking at listing updates, competitor tracking, or sudden review spikes, compare 3-, 7-, and 14-day windows.
That gives you a cleaner read on what’s going on instead of getting pulled around by day-to-day swings.
When does rank movement become meaningful?
Rank movement starts to matter when you stop staring at daily ups and downs. Most single-day changes are just noise.
Instead, look at 7-day or 30-day trends. That gives you a better read on what’s actually happening.
Small moves of 1 to 2 positions usually don’t mean much. A change becomes more meaningful when it sticks for two weeks or when related keywords move together after listing edits, review spikes, or competitor launches.
Can reviews or ads directly improve rank?
Yes - reviews can directly improve search rank. Shopify treats reviews as a key search signal. And it puts more weight on recent activity and steady review velocity than on lifetime totals.
So a steady stream of new, high-quality reviews over the last 90 days does more for rank than a big review base that has gone quiet.
Ads do not directly improve organic rank. They can get you more visibility in paid placements, but Shopify tracks paid ads separately from organic search results.