How Shopify Partners Data Improves App Listings
Use funnel data and analytics to find listing drop-offs, test one change at a time, and improve installs, retention, and revenue.

If I want more installs from the Shopify App Store, I don’t start by guessing. I start with funnel data.
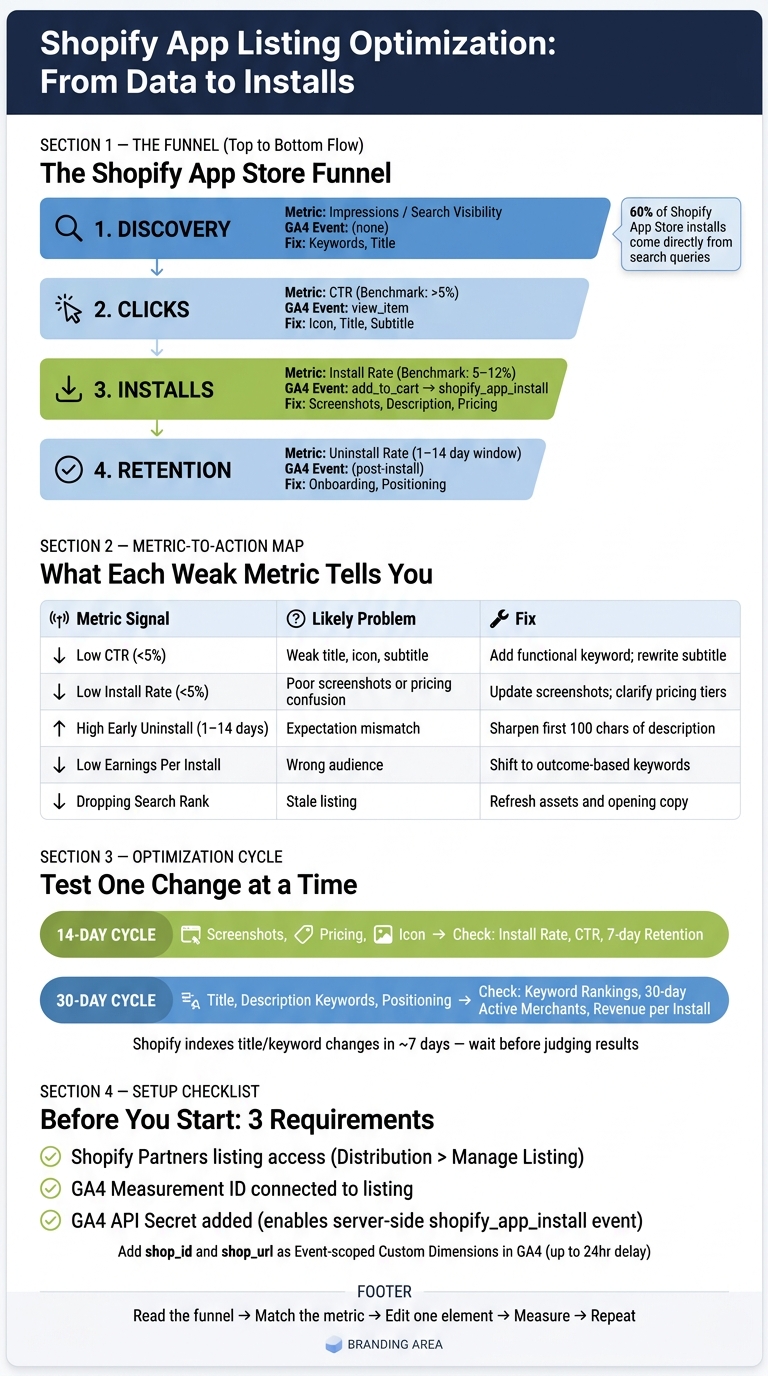
This article shows a simple idea: use Shopify Partners data and GA4 events to find the exact part of the listing that is underperforming. If clicks are low, I look at the title, icon, and subtitle. If visits are fine but installs are weak, I check screenshots, description, and pricing clarity. If merchants uninstall in the first 1–14 days, I treat that as a sign that the listing may be promising the wrong thing.
Here’s the short version:
- Installs alone are not enough
- I need to track views, Install button clicks, completed installs, uninstalls, active merchants, and revenue per install
- Shopify’s GA4 events like
view_item,add_to_cart, andshopify_app_installhelp me see where drop-offs happen - Search drives 60% of Shopify App Store installs, so keyword edits can change both traffic and conversion
- I should test one listing change at a time
- A 14-day cycle works for screenshots, icons, and pricing edits
- A 30-day cycle works better for title and description keyword updates
- Shopify may take about 7 days to index title and keyword changes, so I should not judge edits too early
What I like here is the focus on action. The article is not about staring at dashboards. It is about turning data into listing edits that I can track, compare Shopify optimization tools, and keep or roll back based on results.
Before I change anything, I want three things in place:
- Shopify Partners listing access
- GA4 connected with a Measurement ID
- A GA4 API secret, so install events are not missing
The core lesson is simple: read the funnel, match each weak metric to one listing element, then measure the result over time. That is how I improve discovery, install rate, and retention without guessing.
Shopify App Listing Optimization Funnel: Metrics to Actions
Boost Your Shopify App Listing With These Quick Optimization Techniques

sbb-itb-ce93587
1. Know which Shopify Partners data affects your listing
Start with the numbers that line up with the core funnel: discovery, clicks, installs, and retention.
Partner Dashboard metrics tied to listing performance
The Partner Dashboard shows total installs, active merchants, and merchant growth. It also splits uninstalls into four time windows: same day, 1–14 days, 15–90 days, and 91+ days.
That split matters more than it may seem at first glance. If same-day uninstalls are high, your listing is often setting the wrong expectation. In plain English, merchants click in, install, and then bail almost at once. That usually points to a mismatch between what the listing promises and what the app delivers.
Charge status data helps fill in the picture. It shows whether installs turn into steady revenue or if you're getting a lot of trial activity that doesn't stick.
Put those signals together and you can usually tell where the issue lives:
- Low visibility points to discovery problems
- Low clicks points to weak listing appeal
- Low install completion points to friction during install or setup
- High early uninstall rates points to poor expectation-setting
GA4 funnel events for Shopify App Store traffic
When you connect GA4 to your Partner Dashboard, you can see where merchants drop off in the funnel. Shopify sends four main events to GA4, and each one maps to a stage in your listing journey:
| GA4 Event | Signals | Check |
|---|---|---|
view_item |
Merchant views your app details page | Keywords, icon, title |
add_to_cart |
Merchant clicks the Install button | Screenshots, description, reviews |
shopify_app_install |
Merchant completes installation | Onboarding flow, app speed |
shopify_app_ad_click |
Visit from a Shopify App Store ad | Ad copy, keyword targeting |
This gives you a simple way to diagnose what's off.
Low CTR usually means the problem starts early: your icon, title, or rating snippet isn't doing enough to win the click. Low install rate usually means the listing page isn't closing the deal, so look at screenshots and how clear the description is.
You should also use surface_type and surface_detail to see where traffic came from - search, category, or the home page - and which search terms or category placements are sending visits to your listing.
That detail is gold. It tells you whether you're getting the right traffic or just traffic that looks good on paper.
Once you know where merchants drop off, tie each weak spot to one listing edit. Don't change five things at once and hope for the best. That's like trying to fix a car by swapping half the engine in one go.
Setup requirements before you start
These three items make your data reliable. Before you start optimizing, confirm:
- Active listing access - your Shopify Partners account has access to your app under Distribution > Manage listing
- GA4 Measurement ID - entered in the Tracking information section of that listing
- GA4 API secret - generated in GA4 under Admin > Data Streams > Measurement Protocol API secrets and added to your listing; without it, the
shopify_app_installevent won't fire server-side and install data will be incomplete
One more thing: GA4 event parameters like shop_id and shop_url do not show up in reports by default. Add them as Event-scoped Custom Dimensions in GA4. They can take up to 24 hours to appear.
Set those up before you start reading the numbers. If you skip that step, you're judging listing edits with partial data, and that can send you in the wrong direction.
2. Connect your metrics to specific listing changes
Now take those signals and turn them into edits. The goal is simple: match each drop-off to the part of the listing that’s most likely causing it.
Use funnel metrics to find click-through and install rate problems
Funnel drop-offs help you separate click problems from install problems.
A CTR below 5% usually points to the title, icon, or subtitle. But if view_item counts look healthy while add_to_cart and shopify_app_install events stay weak, the issue likely sits lower in the listing. In that case, the description, screenshots, and pricing are the main suspects. Merchants are clicking in, but they’re not taking the next step.
Use retention and revenue data to sharpen your positioning
If clicks and installs look healthy, shift your attention to retention and revenue. That’s where you can tell whether the listing is pulling in the right merchants.
Uninstall timing and earnings data show whether you're attracting the right merchants. If earnings per install are strong in one segment, that’s a positioning signal. Put those use cases in the first lines of your listing.
If uninstalls spike in the 1–14 day window, your opening copy may be promising the wrong thing too soon. Tighten the language in the first part of the description so it matches the app's actual first value moment.
Build a metric-to-action table before editing your listing
Use this map before you change anything.
| Metric Signal | Likely Problem | Recommended Action |
|---|---|---|
| Low CTR (below 5%) | Weak title, icon, or subtitle | Add a functional keyword, like product review, to the title; rewrite the subtitle around a single merchant outcome |
| Low Install Rate (below 5%) | Poor screenshots or pricing confusion | Update screenshots to show actual UI; clarify free trial vs. paid tiers |
| High Early Uninstall (1–14 days) | Expectation mismatch | Sharpen positioning in the first 100 characters; align copy with core features |
| Low Earnings Per Install | Attracting low-budget or free-tier users | Shift focus from generic "free" keywords to outcome-based terms |
| Dropping Search Rank | Stale listing | Refresh listing assets and tighten the opening copy |
Change one element at a time, then measure for 14 days. After that, look at the result and decide the next move.
3. Use Shopify Partners data to improve keywords and search visibility
Find high-intent search and category traffic
Search traffic only matters if it leads to installs and long-term users. A merchant searching for "photo reviews for Shopify" is much closer to installing than someone browsing "marketing apps." So the goal isn't more traffic for its own sake. It's finding the terms that bring in merchants who install and stick around.
The Search Term report in the Shopify Partner Dashboard, under the Ads section, shows the exact phrases merchants typed before clicking your listing. That gives you a direct look at search intent. To surface more high-intent phrases, run a low-bid broad-match campaign. This can reveal terms the Search Term report may not catch on its own.
Category terms can help you win visibility at the top of the funnel. Then your description can do the heavy lifting by repeating the workflow term that matches what the merchant is trying to get done. That way, you don't just get the click - you line up the listing with the reason they searched in the first place.
Once you know whether the problem is visibility or conversion, search-term data gives you a much clearer next move for keyword testing.
Update title and description keywords based on conversion data
High impressions with weak installs usually mean the keyword is getting attention, but not from the right merchants. Track Install button clicks in GA4 to see which search terms lead to installs, not just listing views. If a term brings strong view volume but weak Install clicks, one of two things is probably happening: the keyword is attracting the wrong audience, or your listing doesn't match the promise behind that term.
This matters a lot because 60% of all Shopify App Store installs come directly from search queries. In plain English, the keywords in your title and description aren't just there to help discovery. They help sell the install too.
Focus on terms that show up in install data, not just impression totals. And if a keyword drives installs but those merchants churn fast, that's usually a positioning problem. In that case, the fix may be in the copy, not only in the keyword set.
Shopify usually takes about 7 days to index changes to your title, search terms, and app details fields. So give each update enough time before you judge the result. If you change too much too fast, you'll end up guessing.
Combine Shopify Partners data with AppJubilee keyword tracking
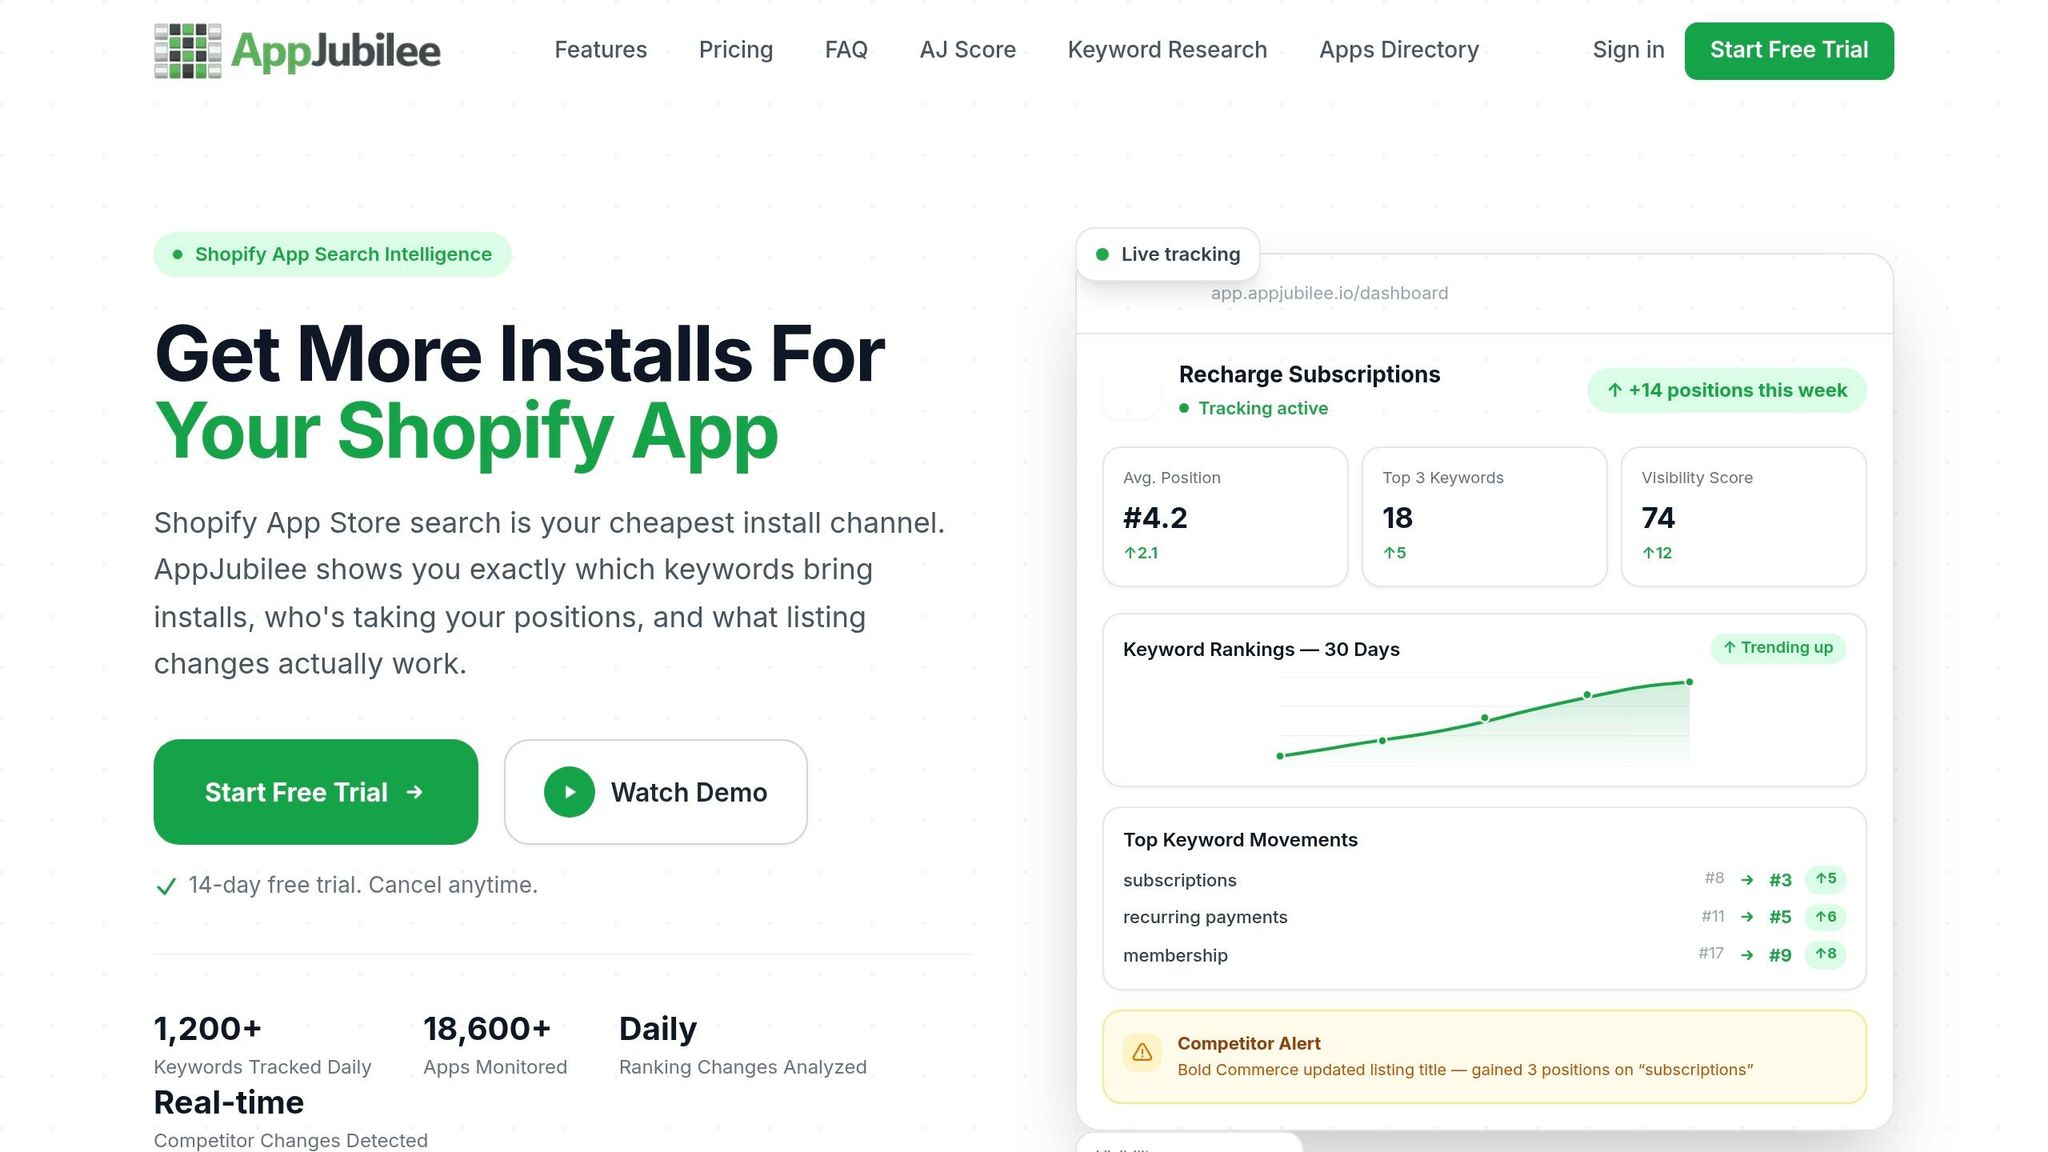
Shopify Partners tells you what happened: views, installs, and revenue. What it doesn't tell you is where your app ranks for the terms behind that traffic. That's the missing piece.
Use Shopify Partners data to spot which keywords are worth more attention. Then layer in rank tracking so you can see what to do next.
AppJubilee fills that gap by tracking daily keyword rankings across 1,200+ Shopify App Store keywords and keeping a 90-day historical ranking database. With AppJubilee's daily rank tracking and past snapshots, you can see which keywords are tied to installs and revenue, not just impressions.
For each keyword, make one of these calls:
- Keep terms that rank and convert
- Optimize terms that rank but underconvert
- Move up terms with strong revenue per install
- Drop terms with weak installs and weak revenue
Use the top-converting terms in the next 14-day test cycle. Then change just one keyword at a time in the next optimization round.
4. Run a 14-day or 30-day listing optimization cycle
Change one listing element at a time
Once you spot the weakest metric, test one fix at a time in a controlled cycle. That way, the result ties back to one listing element instead of turning into a messy guessing game.
The cycle length depends on the kind of change you make. A 14-day cycle works well for visual updates or pricing changes. A 30-day cycle makes more sense for title and description keyword edits, since new keywords usually need 2–4 weeks to build enough impressions for a fair read.
Here’s a simple map for matching each edit to the metric it should affect:
| Cycle Length | Best For | Key Metrics to Watch |
|---|---|---|
| 14-Day | New screenshots, pricing changes, icon updates | Install rate, CTR, 7-day retention |
| 30-Day | Title rewrites, description keywords, positioning shifts | Keyword rankings, 30-day active merchants, revenue per install |
Measure before-and-after results with Shopify Partners analytics
Before you change anything, record your baseline date and metrics. Pull your current CTR, conversion rate, uninstall rate, and revenue per install from the Shopify Partner Dashboard, and use AppJubilee to log keyword rankings.
Also record CTR, install rate, retention, and keyword rank before the update. And make sure view_item, add_to_cart, and shopify_app_install are firing so you can follow the full funnel during the cycle.
When the cycle ends, compare the same metrics against that baseline. A simple check-in rhythm is day 3, day 7, and day 14 after the change. Early numbers can warn you if something went off the rails. Then use day 14 or day 30 to decide whether to keep the edit or roll it back.
The pattern in the data usually tells you where to look next:
- If CTR drops, the issue is probably your icon, title, or tagline.
- If installs drop but CTR stays flat, check your screenshots, pricing clarity, or reviews.
That’s the whole point of doing this in cycles. Each metric points to a specific part of the listing, so your next move comes from evidence, not hunches.
Track listing changes with AppJubilee and keep an impact log
Shopify Partners shows what happened to installs and revenue, but it won’t show whether keyword rankings moved after you changed your title. AppJubilee’s listing change impact tracking helps connect those edits to ranking movement.
Keep a simple impact log for every cycle. It doesn’t need to be fancy. A shared spreadsheet is enough. What matters is having a clean record the team can scan in a few seconds.
| Change Date | Listing Element Edited | Before | After | Result |
|---|---|---|---|---|
| June 1, 2026 | App Title (Added "Loyalty") | Rank #12 for "loyalty" | Rank #4 for volume discounts | +15% installs |
| June 15, 2026 | Screenshots (Outcome-first) | 4.2% CTR | 6.8% CTR | Higher conversion |
| June 25, 2026 | Title: Added "Upsell" | 3.2% CTR | 4.1% CTR | +4 positions for "upsell" |
Use that log to decide the next edit.
Conclusion: Build a listing strategy that improves over time
After one or two test cycles, the pattern usually starts to show.
A strong app listing doesn’t come from guesswork. It comes from a repeatable loop: read the metrics, find the problem, update the listing, and measure what changed. Run that loop on a steady 14- or 30-day rhythm, and the gains start to stack up.
Each metric tells you something different. Traffic problems usually point to keywords and visibility. Conversion problems often trace back to your creative assets and copy. Retention problems tend to signal an issue with positioning.
Those are the calls that matter when you turn data into listing edits.
Key takeaways for Shopify app teams
The best teams keep doing three simple things: they watch the right metrics, they record every change, and they let the data show them what to fix next.
Here’s what to keep from this guide:
- Start with reliable data. Connect both Shopify Partners and GA4 before you change anything on your listing.
- Match every fix to a metric. Low CTR usually points to your title or icon. A weak install rate on high-intent terms - healthy benchmark: 5–12% - usually points to your screenshots or description.
- Prioritize high-intent keywords. Put your keyword slots toward terms where merchants already know what they want.
- Log every change. A plain spreadsheet with the date, the edit, and before-and-after metrics is enough.
- Use AppJubilee's listing change tracking to tie edits to ranking movement.
Keep the pace steady. Review, edit, measure, repeat. Each cycle makes the next one a little sharper.
FAQs
How much data do I need before changing a listing?
Monitor keyword rankings and traffic for at least 30 days before you change your listing. That gives you enough time to spot the difference between a real shift and normal ranking noise. A monthly or quarterly review cadence usually works well for this.
Use your Shopify Partner Dashboard to track conversion rates and traffic sources. That way, you can see whether your keywords are bringing in actual installs - not just impressions.
What should I fix first if installs go up but early uninstalls stay high?
First, check whether your listing matches the actual app experience. Another issue could be a weaker product-market fit. If people uninstall the app soon after downloading it, that’s often a sign that they didn’t get the value they expected. Over time, that can hurt your rankings.
Go back to your core value proposition and test it with users. Then make sure your listing shows, in plain terms, what the app actually does. AppJubilee can help you track listing changes and review feedback so you can spot friction points and tighten your messaging.
How do I tell if a keyword is bringing the wrong traffic?
Compare a keyword’s ranking and click-through rate with installs, revenue, and retention. That side-by-side view tells you whether a term is pulling in the right people or just driving empty traffic.
If a keyword gets strong visibility and plenty of clicks but leads to low installs, weak retention, or frequent uninstalls, it’s probably bringing in the wrong audience.
With AppJubilee, you can line up keyword rankings with GA4 traffic and competitor keyword data to see if those terms match your target merchant’s needs.